The Computational Microscope: How Molecular Dynamics Simulations Reveal Hidden Biological Processes
Molecular dynamics (MD) simulations function as a powerful computational microscope, providing atomistic resolution into the dynamic behavior of proteins and other biomolecules that is often inaccessible to experimental techniques.
The Computational Microscope: How Molecular Dynamics Simulations Reveal Hidden Biological Processes
Abstract
Molecular dynamics (MD) simulations function as a powerful computational microscope, providing atomistic resolution into the dynamic behavior of proteins and other biomolecules that is often inaccessible to experimental techniques. This article explores the foundational principles of MD, its diverse methodological applications in areas like drug discovery and protein folding, the critical limitations and troubleshooting strategies for reliable simulations, and the essential process of validating computational results against experimental data. Aimed at researchers, scientists, and drug development professionals, this review synthesizes how MD serves as an indispensable tool for guiding experimental efforts, rational drug design, and making genuine discoveries in modern biomedical research.
What is a Computational Microscope? The Core Principles of Molecular Dynamics
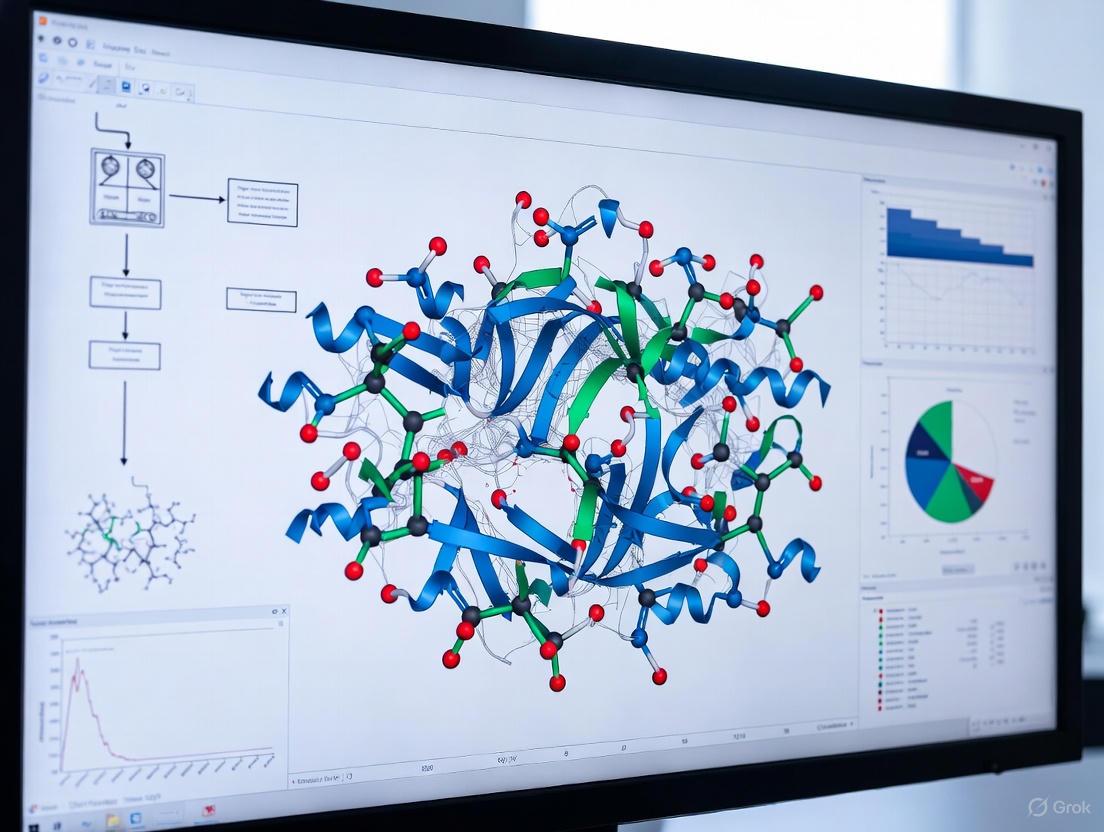
Molecular dynamics (MD) simulations have emerged as a powerful "computational microscope," allowing researchers to visualize the dynamic motion of atoms and molecules with unprecedented detail [1]. At the heart of this methodology lies the molecular dynamics trajectory—a time-ordered sequence of snapshots representing the atomic coordinates of a simulated system [2]. These trajectories transform static structural data into dynamic movies, revealing the physical mechanisms that govern biological function and facilitating rational drug design [3] [1].
The Molecular Dynamics Trajectory: A Core Concept
A molecular dynamics trajectory is the principal output of an MD simulation, capturing the evolution of a molecular system over time. In essence, trajectories are sequential snapshots of the simulated molecular system, representing atomic coordinates at specific time intervals [2].
Technical Composition and Significance
From a technical perspective, trajectory files contain the three-dimensional positional data for all atoms in a simulation system across numerous time steps. The information content of these trajectories is vast, encoding:
- Structural Evolution: The trajectory records the pathway of conformational changes, from subtle side-chain rotations to large-scale domain movements [2] [4].
- Energetic Landscape: When combined with force field parameters, trajectories enable the calculation of potential and kinetic energy fluctuations throughout the simulation [2].
- Temporal Dynamics: The sequential nature of frames allows researchers to analyze the kinetics and rates of molecular processes [3].
The profound value of MD trajectories lies in their ability to extend static structural biology into the dynamic realm. While experimental methods like X-ray crystallography and cryo-EM provide crucial structural snapshots, MD trajectories animate these structures, revealing how they move, flex, and interact over time [3]. This dynamic information is essential for understanding the fundamental mechanisms of biological processes such as protein folding, ligand binding, and allosteric regulation [1].
MD as a Computational Microscope
The metaphor of MD simulations as a "computational microscope" powerfully captures their ability to reveal biological processes inaccessible to direct experimental observation [3] [1]. This virtual instrument provides unprecedented spatial and temporal resolution into molecular phenomena.
Bridging Spatial and Temporal Scales
The computational microscope achieves its power by bridging critical gaps in our observational capabilities:
| Scale Type | Experimental Challenge | MD Capability | Biological Impact |
|---|---|---|---|
| Spatial | Membrane proteins difficult to crystallize [2]; Limited by wavelength of light | Atomic-level resolution of large complexes (>100 million atoms) [5] | Visualization of viral capsids, ribosomes, and entire organelles [5] |
| Temporal | Fast processes beyond experimental time resolution; Slow processes impractical to observe | Femtosecond resolution; Microsecond to millisecond reach with advanced methods [1] | Observation of protein folding, ligand binding, and conformational changes [3] |
Validation Through Experimental Correlation
The predictive power of the computational microscope has been validated through several landmark studies:
- Titin Mechanics: SMD simulations of the muscle protein titin revealed forced unfolding pathways that complemented atomic force microscopy (AFM) experiments, establishing the molecular basis of muscle elasticity [3].
- CRISPR-Cas9 Dynamics: Gaussian accelerated MD (GaMD) simulations predicted the structure of the active CRISPR-Cas9 complex before experimental characterization, with remarkable correspondence between simulation and subsequent experimental results [1].
- Viral Protein Modeling: MD simulations have successfully refined predicted structures of viral proteins like HCV core protein, improving model quality to near-experimental accuracy [6].
These examples demonstrate how the computational microscope can not only interpret but also predict molecular behavior, establishing MD as a genuine discovery tool in structural biology [3].
Generation and Analysis of MD Trajectories
The process of generating and analyzing MD trajectories follows a structured workflow that transforms initial molecular coordinates into scientifically meaningful dynamic information.
Trajectory Generation Workflow
The following diagram illustrates the standard workflow for generating MD trajectories:
This workflow consists of several critical phases:
- System Preparation: Initial 3D structures, typically from the Protein Data Bank (PDB), are prepared by adding solvent molecules, ions, and other components to create a biologically relevant environment [2].
- Minimization: The system's energy is minimized to remove steric clashes and unfavorable contacts [7].
- Heating: The temperature is gradually increased from near absolute zero to the target temperature (e.g., 300 K) while allowing the system to adjust [7].
- Equilibration: The system is allowed to stabilize at the target temperature and pressure until properties like energy and density reach steady states [7].
- Production Simulation: The actual data-collection phase where trajectories are saved at regular intervals (typically 1-100 ps) for subsequent analysis [7].
Trajectory Analysis Techniques
Once trajectories are generated, various analytical methods extract meaningful biological insights:
| Analysis Type | Key Metrics | Biological Information | Example Tools |
|---|---|---|---|
| Geometric Analysis | Root mean square deviation (RMSD), radius of gyration (Rg), dihedral angles [6] | Structural stability, compactness, conformational changes [6] | GROMACS, MDAnalysis |
| Dynamic Analysis | Root mean square fluctuation (RMSF), B-factors [6] | Regional flexibility, residue mobility | VMD, CHARMM |
| Energetic Analysis | Potential energy, hydrogen bonding, interaction energies | Stability, key interactions, binding affinities | NAMD, AMBER |
| Pathway Analysis | Principal component analysis (PCA), free energy landscapes | Conformational pathways, metastable states | PyEMMA, MDAnalysis |
Quantitative analysis of trajectories enables researchers to move beyond qualitative observation to statistically rigorous characterization of molecular behavior. For example, calculating the root mean square deviation (RMSD) of backbone atoms provides a measure of structural stability, while root mean square fluctuation (RMSF) of Cα atoms reveals regions of flexibility and mobility within the protein structure [6].
Visualization Methodologies
Effective visualization is crucial for interpreting the complex spatial and temporal data contained in MD trajectories [5]. The field has evolved from simple frame-by-frame animation to sophisticated multi-scale representations.
Visualization Techniques and Tools
The computational microscopy paradigm relies heavily on visualization to communicate dynamic molecular processes:
Advanced visualization tools have been developed specifically for MD trajectory analysis:
- VMD (Visual Molecular Dynamics): A specialized tool for visualization and analysis of biological systems like proteins, nucleic acids, and lipid membranes [2]. It supports numerous file formats, handles large datasets, and offers extensive visualization and rendering capabilities [2].
- Web-Based Tools: Increasingly popular platforms like Mol* offer accessible trajectory visualization directly in web browsers, facilitating collaboration and data sharing [5].
- Virtual Reality Environments: Immersive VR systems allow researchers to "step inside" molecular simulations, providing intuitive understanding of complex 3D dynamics [5].
Design Principles for Effective Communication
When creating visualizations of MD trajectories for educational or communicative purposes, several design principles help avoid common misconceptions [8]:
- Avoid Molecular Agency: Representations should not depict molecules as having purpose or intention; instead, they should illustrate stochastic motion driven by physical forces [8].
- Balance Abstraction and Realism: The appropriate level of detail depends on the audience—experts can interpret higher abstraction, while novices may require more contextual cues [8].
- Represent Accurate Temporal Scales: Animations should respect the actual relative timescales of molecular processes, from rapid bond vibrations (femtoseconds) to slow conformational changes (microseconds to milliseconds) [8].
Advanced Applications and Current Frontiers
MD trajectory analysis continues to evolve, pushing the boundaries of what can be studied with the computational microscope.
Accelerated Dynamics Methods
A significant challenge in conventional MD is the timescale gap between simulation and biologically relevant processes. Advanced sampling methods address this limitation:
- Gaussian Accelerated MD (GaMD): This technique smooths the potential energy surface, reducing energy barriers and accelerating simulations by thousands to millions of times [1]. GaMD has enabled studies of previously inaccessible processes like CRISPR-Cas9 complex formation and drug dissociation from protein targets [1].
- Steered MD (SMD): Applying external forces to simulate mechanical manipulation of molecules, SMD has been particularly valuable for studying protein folding and mechanical strength in proteins like titin and fibrinogen [3].
Emerging Frontiers
Current research is expanding the capabilities of the computational microscope in several directions:
- Extreme Scale Simulations: Recent achievements include simulations of complete viral envelopes (305 million atoms) and entire minimal cells, providing system-level understanding of biological processes [5].
- Machine Learning Integration: Deep learning approaches are being used to embed high-dimensional trajectory data into lower-dimensional latent spaces, revealing essential features and patterns that might be missed by conventional analysis [5].
- Interactive Visualization: Web-based platforms and virtual reality environments are making trajectory data more accessible and interpretable, allowing researchers to explore complex dynamics intuitively [5].
Researchers working with MD trajectories utilize a comprehensive suite of software tools and resources:
| Tool Category | Key Resources | Primary Function |
|---|---|---|
| Simulation Engines | GROMACS [2], NAMD [2] [3], AMBER, CHARMM [2] | Performing MD simulations and generating trajectories |
| Analysis Packages | VMD [2], MDAnalysis, pDynamo [7] | Trajectory visualization, measurement, and analysis |
| Specialized Methods | GaMD [1], SMD [3] | Enhanced sampling for accelerated dynamics |
| Force Fields | CHARMM, AMBER, OPLS | Mathematical descriptions of interatomic interactions |
This toolkit enables the full trajectory lifecycle—from system setup through simulation, analysis, and visualization—providing researchers with a complete workflow for computational microscopy.
Molecular dynamics trajectories transform atomic coordinates into dynamic movies of biological processes, providing the core data that powers the computational microscope. As MD methodologies continue to advance—through improved force fields, enhanced sampling algorithms, and more sophisticated visualization techniques—the resolution and scope of this virtual microscope will continue to expand. These advances promise deeper insights into the molecular mechanisms of health and disease, accelerating drug discovery and expanding our fundamental understanding of life at the atomic scale. The trajectory concept remains central to this endeavor, serving as both the computational record of molecular motion and the bridge between static structures and biological function.
Molecular dynamics (MD) simulation serves as a powerful computational microscope, allowing researchers to observe the motion of atoms and molecules over time. The core engine that drives this microscope is the force field, a computational model that describes the forces between atoms within molecules or between molecules [9]. Within the framework of Newtonian physics, these forces determine the acceleration of every particle in the system, enabling the prediction of their future positions and velocities. This combination provides an atomistic view of processes that are often impossible to see in a wet lab, from protein folding to drug binding, making it an indispensable tool in modern computational chemistry, biology, and materials science [10].
The Mathematical Foundation of Force Fields
The Basic Functional Form
In the context of chemistry and molecular modeling, a force field refers to the functional form and parameter sets used to calculate the potential energy of a system of atoms [9]. The total potential energy ((E_{total})) in a typical additive force field for molecular systems is a sum of bonded and non-bonded interactions, and can be expressed as:
[E{\text{total}} = E{\text{bonded}} + E_{\text{nonbonded}}]
Where the bonded interactions themselves are a sum of several components:
[E{\text{bonded}} = E{\text{bond}} + E{\text{angle}} + E{\text{dihedral}}]
And the non-bonded interactions comprise:
[E{\text{nonbonded}} = E{\text{electrostatic}} + E_{\text{van der Waals}}]
This decomposition provides a physically motivated model for the various interactions that govern molecular structure and dynamics [9].
Connecting Force to Motion: Newton's Second Law
The connection between the force field and molecular motion is established through Newton's second law of motion. The force field is used to calculate the potential energy, and the force ((\vec{F}_i)) acting on each particle (i) is derived as the negative gradient of this potential energy with respect to the particle's coordinates [9]:
[\vec{F}i = -\nablai E_{\text{total}}]
This force is then related to the particle's acceleration ((\vec{a}_i)) through Newton's famous equation:
[\vec{F}i = mi \vec{a}_i]
Where (m_i) is the mass of the particle. By numerically integrating these equations of motion, MD simulations predict the trajectory of the system through time [11].
Components of a Classical Force Field
Bonded Interactions
Bonded interactions describe the energy associated with the covalent bond structure of molecules.
Bond Stretching: The energy required to stretch or compress a bond between two atoms from its equilibrium length. This is most often modeled using a harmonic potential [9]: [E{\text{bond}} = \frac{k{ij}}{2}(l{ij} - l{0,ij})^2] where (k{ij}) is the force constant, (l{ij}) is the current bond length, and (l_{0,ij}) is the equilibrium bond length.
Angle Bending: The energy associated with the deviation of the angle between three bonded atoms from its equilibrium value. This is also typically modeled with a harmonic potential.
Dihedral/Torsional Interactions: The energy related to the rotation around a central bond connecting four atoms. The functional form for dihedral energy is more variable between different force fields [9].
Table 1: Bonded Interactions in a Typical Force Field
| Interaction Type | Mathematical Form | Description | Atoms Involved |
|---|---|---|---|
| Bond Stretching | (E = \frac{k}{2}(l - l_0)^2) | Harmonic potential for bond length variation | 2 |
| Angle Bending | (E = \frac{k{\theta}}{2}(\theta - \theta0)^2) | Harmonic potential for bond angle variation | 3 |
| Dihedral/Torsion | (E = k_{\phi}(1 + \cos(n\phi - \delta))) | Periodic potential for bond rotation | 4 |
Non-Bonded Interactions
Non-bonded interactions describe the forces between atoms that are not directly connected by covalent bonds, and are computationally the most intensive part of force field calculations.
Van der Waals Interactions: These short-range forces account for dispersion and repulsion. They are often modeled using the Lennard-Jones potential [9]: [E_{\text{van der Waals}} = 4\epsilon \left[ \left(\frac{\sigma}{r}\right)^{12} - \left(\frac{\sigma}{r}\right)^{6} \right]] where (\epsilon) is the depth of the potential well, (\sigma) is the distance at which the potential is zero, and (r) is the distance between atoms.
Electrostatic Interactions: These long-range forces between charged particles are described by Coulomb's law [9]: [E{\text{Coulomb}} = \frac{1}{4\pi\varepsilon0} \frac{qi qj}{r{ij}}] where (qi) and (qj) are the partial atomic charges, (r{ij}) is the distance between them, and (\frac{1}{4\pi\varepsilon_0}) is the Coulomb constant.
Table 2: Non-Bonded Interactions in a Typical Force Field
| Interaction Type | Mathematical Form | Description | Range |
|---|---|---|---|
| Van der Waals | (E = 4\epsilon \left[ \left(\frac{\sigma}{r}\right)^{12} - \left(\frac{\sigma}{r}\right)^{6} \right]) | Lennard-Jones potential for dispersion/repulsion | Short |
| Electrostatic | (E = \frac{1}{4\pi\varepsilon0} \frac{qi qj}{r{ij}}) | Coulomb's law for charge-charge interactions | Long |
Workflow of a Molecular Dynamics Simulation
The following diagram illustrates the core cycle of a Molecular Dynamics simulation, showing how the force field and Newton's laws are applied iteratively to generate a trajectory.
Parameterization and the Scientist's Toolkit
Force Field Parameterization
The parameters for a chosen energy function are derived from classical laboratory experiment data, calculations in quantum mechanics, or a combination of both [9]. The assignment of atomic charges often follows quantum mechanical protocols with some heuristics, which can lead to significant deviation in representing specific properties. Heuristic force field parametrization procedures have been very successful for many years, but recently criticized since they are usually not fully automated and therefore subject to some subjectivity of the developers [9].
Research Reagent Solutions: Essential Components
Table 3: Essential Force Field Components and Research Reagents
| Component/Reagent | Function in Simulation | Key Considerations |
|---|---|---|
| Force Field Software | Implements the mathematical models to calculate forces and energies. | Examples: GROMACS, AMBER, CHARMM, OpenMM [11]. |
| Parameter Sets | Provide specific numerical values for bond lengths, angles, charges, etc. | Transferability vs. specificity; AMBER, CHARMM, OPLS are common [9]. |
| Atom Typing Rules | Define atom categories based on element and chemical environment. | Determines parameter assignment; crucial for accuracy [9]. |
| Water Models | Simulate solvent effects (e.g., TIP3P, SPC, TIP4P). | Choice significantly affects biomolecular simulation results. |
| Quantum Chemistry Codes | Generate reference data for force field parameterization (e.g., Gaussian). | Provide target energies and forces for fitting [9]. |
Advanced Force Field Types and Future Directions
Beyond Classical Force Fields
While the functional forms described above are common in biomolecular simulation, different modeling challenges require specialized force fields:
- Reactive Force Fields: Methods like ReaxFF are designed to simulate bond breaking and formation, which is not possible with standard harmonic bond potentials [11].
- Polarizable Force Fields: These go beyond fixed atomic charges to account for the fact that the electronic distribution of an atom can be distorted by its environment, offering improved accuracy at increased computational cost [9].
- Machine-Learned Force Fields (ML-FFs): A cutting-edge approach that uses machine learning to construct force fields with the accuracy of high-level ab initio quantum mechanical calculations, but at a fraction of the computational cost. These models can learn complex potential energy surfaces directly from reference quantum data, potentially enabling "spectroscopic accuracy" in molecular simulations [10].
The Future: Machine-Learned Force Fields
A 2018 study in Nature Communications demonstrated a symmetrized gradient-domain machine learning (sGDML) approach that faithfully reproduces global force fields at a quantum-chemical CCSD(T) level of accuracy [10]. This approach incorporates spatial and temporal physical symmetries into the model in a data-driven way, allowing for converged molecular dynamics simulations with fully quantized electrons and nuclei. Such ML-FFs provide the key missing ingredient for achieving spectroscopic accuracy in molecular simulations, pushing the resolution of the "computational microscope" to new limits [10].
Molecular dynamics (MD) simulations have undergone a revolutionary transformation, evolving from limited picosecond-scale observations to comprehensive millisecond-scale studies, effectively serving as a computational microscope for researchers. This evolution, largely driven by breakthroughs in advanced computing hardware and algorithms, has enabled the detailed study of complex biomolecular processes that are central to drug discovery and development. By applying Newton's laws of motion to atomic-level systems, MD simulations provide an unparalleled view into the dynamic behavior of proteins and other biomolecules, capturing everything from conformational changes and ligand binding to protein folding and functional mechanisms. The integration of specialized hardware, sophisticated software suites, and enhanced sampling techniques has narrowed the gap between computational models and actual cellular conditions, making MD an indispensable tool in modern medicinal chemistry and biomedical research.
The concept of a "computational microscope" perfectly encapsulates the transformative power of molecular dynamics (MD) simulations in biomedical research. Just as a microscope reveals a world invisible to the naked eye, MD simulations provide a window into the intricate, dynamic world of biomolecular processes, predicting how every atom in a protein or other molecular system will move over time based on the physics governing interatomic interactions [12]. These simulations capture structural flexibility and molecular interactions with exceptional detail, offering insights that are often difficult or impossible to obtain through experimental means alone [13] [12].
The foundational principle of MD is straightforward: given the positions of all atoms in a biomolecular system, one can calculate the force exerted on each atom by all other atoms and use Newton's laws of motion to predict atomic spatial positions over time [12]. The resulting trajectory is essentially a three-dimensional movie describing the atomic-level configuration of the system throughout the simulated period, typically at femtosecond (10^-15 seconds) temporal resolution [12]. This fine resolution allows researchers to observe molecular events with precision that complements various experimental structural biology techniques, including X-ray crystallography, cryo-electron microscopy (cryo-EM), nuclear magnetic resonance (NMR), and Förster resonance energy transfer (FRET) [12].
Historical Trajectory: Expanding Timescales in MD Simulations
The evolution of MD simulation capabilities represents one of the most significant advancements in computational biochemistry, with simulation timescales expanding by approximately six orders of magnitude over several decades.
Table: Historical Progression of MD Simulation Timescales
| Time Period | Typical Maximum Timescale | Key Technological Enablers | Representative Simulable Processes |
|---|---|---|---|
| 1970s-1980s | Picoseconds (10^-12 s) to Nanoseconds (10^-9 s) | Early supercomputers, Basic force fields | Local side-chain motions, Bond vibrations |
| 1990s-2000s | Nanoseconds (10^-9 s) to Microseconds (10^-6 s) | Improved algorithms, Distributed computing | Small protein folding, Loop motions |
| 2010s-Present | Microseconds (10^-6 s) to Milliseconds (10^-3 s) | GPU computing, Specialized hardware (Anton) | Large protein folding, Ligand binding, Conformational changes in membrane proteins |
The first MD simulations of simple gasses were performed in the late 1950s, with the first protein MD simulation following in the late 1970s [12]. The groundwork enabling these early simulations was among the achievements recognized by the 2013 Nobel Prize in Chemistry [12]. For years, most high-impact MD work required supercomputer access, but recent introductions of computer hardware, particularly graphics processing units (GPUs), have made powerful simulations accessible at modest cost [12]. This hardware revolution, combined with substantial improvements in the physical models underlying MD simulations, has enabled the field to progress from picosecond-scale observations to millisecond-scale studies, capturing biologically relevant timescales for numerous critical processes [12].
Successful MD simulations require careful selection of software, hardware, and theoretical frameworks. The table below summarizes key "research reagent solutions" essential for modern MD investigations.
Table: Essential Research Reagents for Molecular Dynamics Simulations
| Resource Category | Specific Tools | Primary Function | Key Applications |
|---|---|---|---|
| MD Software Packages | GROMACS, AMBER, DESMOND, NAMD, DL_POLY | Provides simulation engines with implemented algorithms and force fields | Biomolecular simulation, Drug binding studies, Material science [13] [14] [15] |
| Force Fields | CHARMM, AMBER | Mathematical functions describing potential energy and interatomic forces | Determining interaction parameters for proteins, nucleic acids, lipids [13] [16] |
| Specialized Hardware | NVIDIA GPUs (RTX 4090, RTX 6000 Ada), AMD Threadripper PRO CPUs | Accelerates computational intensive calculations through parallel processing | Speeding up simulations of large systems (>100,000 atoms), Multiple parallel runs [15] |
| Sampling Methods | Replica Exchange, Metadynamics | Enhances sampling of conformational space and rare events | Protein folding, Drug binding/unbinding studies [16] |
| Analysis Tools | Built-in package utilities, VMD, MDAnalysis | Processes trajectory data to extract structural and dynamic properties | Calculating binding free energies, RMSD, Principal components [17] |
Force Fields: The Physical Heart of MD
Force fields represent the mathematical foundation of MD simulations, providing the potential energy functions that describe how atoms interact with each other [16]. These approximations of quantum mechanical interactions include terms for electrostatic (Coulombic) interactions, spring-like terms for covalent bond lengths, and other interatomic interactions [12]. The selection of an appropriate force field is essential, as it significantly influences simulation reliability [13]. Widely adopted force fields like CHARMM and AMBER have been rigorously tested and show consistent performance across diverse biological applications [13] [16].
Computational Hardware: From CPUs to GPUs
The computational demands of MD simulations require specialized hardware configurations. While traditional central processing units (CPUs) remain important, graphics processing units (GPUs) have revolutionized the field by dramatically accelerating simulation speeds [12] [15]. For molecular dynamics workloads, the key factor when selecting a CPU is to prioritize processor clock speeds over core count, with well-suited choices including mid-tier workstation CPUs with a balance of higher base and boost clock speeds, like the AMD Threadripper PRO 5995WX [15].
For GPUs, NVIDIA's offerings—particularly the RTX 4090, RTX 6000 Ada, and RTX 5000 Ada—have proven exceptional for MD simulations [15]. The RTX 6000 Ada, with 48 GB of GDDR6 VRAM and 18,176 CUDA cores, is ideal for memory-intensive simulations, while the RTX 4090 provides an excellent balance of price and performance for smaller simulations [15]. Multi-GPU setups can further dramatically enhance computational efficiency and decrease simulation times for software packages like AMBER, GROMACS, and NAMD [15].
Key Methodologies: Experimental Protocols in MD
Ensemble Selection: NVE, NVT, and NPT
The choice of thermodynamic ensemble is fundamental to MD simulation design, defining which thermodynamic quantities are held constant during the simulation [16]. The three primary ensembles include:
- NVE Ensemble (Microcanonical Ensemble): Maintains constant Number of particles, Volume, and Energy. This ensemble is typically used for isolated systems where energy conservation is crucial, such as in gas-phase simulations or molecular reactions [16].
- NVT Ensemble (Canonical Ensemble): Maintains constant Number of particles, Volume, and Temperature. This ensemble is appropriate for simulating systems at fixed temperature, such as biological systems at physiological conditions. Temperature is typically regulated using methods like the Nose-Hoover thermostat [16].
- NPT Ensemble (Isothermal-Isobaric Ensemble): Maintains constant Number of particles, Pressure, and Temperature. This is ideal for studying systems under constant pressure and temperature, such as liquid simulations or large biomolecular systems, with pressure control often managed by the Berendsen barostat [16].
Simulation Workflow: From System Setup to Analysis
A complete MD simulation follows a structured workflow that can be conceptually divided into three main phases, as illustrated in the following diagram:
MD Simulation Workflow
The workflow begins with system setup, which involves obtaining initial coordinates from experimental structure determination methods or homology modeling, placing the molecular system in a simulation box with appropriate dimensions, adding solvent molecules (typically water), and introducing ions to neutralize the system's charge [17]. This is followed by energy minimization, which removes steric clashes and unfavorable contacts by finding the nearest local energy minimum through methods like steepest descent or conjugate gradient algorithms [16].
The equilibration phase brings the system to the desired temperature and pressure through simulated annealing and pressure coupling algorithms [16]. During the crucial production run, the actual data collection occurs as the system evolves according to Newton's laws of motion, typically using integration algorithms like Verlet with time steps of 1-2 femtoseconds [16]. Finally, trajectory analysis extracts biologically relevant information from the raw coordinate data, calculating properties such as root-mean-square deviation (RMSD), radius of gyration, hydrogen bonding patterns, and principal components of motion [17].
Enhanced Sampling Techniques
To address the challenge of simulating rare events that occur beyond typical MD timescales, researchers employ enhanced sampling methods:
- Metadynamics: This technique accelerates the exploration of free energy surfaces by adding history-dependent bias potentials along selected collective variables, effectively filling energy wells and pushing the system to explore new configurations [16].
- Replica Exchange Molecular Dynamics (REMD): Also known as parallel tempering, this method runs multiple simulations of the same system at different temperatures simultaneously, periodically attempting exchanges between replicas according to a Metropolis criterion, thus enhancing conformational sampling [16].
MD as a Computational Microscope: Applications in Drug Development
Molecular dynamics simulations serve as a powerful computational microscope across multiple stages of drug discovery and development, particularly for neurological and neurodegenerative disorders.
Studying Protein-Ligand Interactions
MD simulations provide critical insights into drug binding mechanisms, capturing the dynamic process of ligand recognition and binding to therapeutic targets [13] [12]. This is particularly valuable for studying proteins critical to neuronal signaling and those representing targets of most neuroscience medications, including ion channels, neurotransmitter transporters, and G protein-coupled receptors (GPCRs) [12]. Simulations reveal binding pathways, residence times, and conformational changes induced by ligand binding—information crucial for rational drug design [13].
Investigating Protein Misfolding and Aggregation
MD simulations have proven invaluable for studying pathological protein aggregation associated with neurodegenerative disorders like Alzheimer's and Parkinson's diseases [12] [18]. Researchers use MD to reveal mechanisms of protein misfolding and oligomer formation, providing molecular-level insights into disease progression and identifying potential therapeutic intervention points [12] [18]. In Alzheimer's disease research specifically, computational methods including MD have contributed to understanding pathological mechanisms at the molecular level, target identification, and lead compound discovery [18].
Enhancing Structure-Based Drug Design
The atomic-level detail provided by MD simulations complements experimental structural biology by modeling the structural flexibility and dynamics of drug targets [13] [12]. This is particularly important for membrane proteins, which have historically been difficult to study experimentally but represent prominent drug targets [12]. Recent breakthroughs in crystallographic structure determination and cryo-EM have delivered numerous such structures, providing starting points for MD simulations that investigate functional mechanisms and assist in structure-based drug design [12].
Current Challenges and Future Directions
Despite remarkable progress, MD simulations face several significant challenges that guide future development directions. The table below summarizes these challenges and corresponding emerging solutions.
Table: Challenges and Future Directions in MD Simulations
| Current Challenge | Impact on Research | Emerging Solutions |
|---|---|---|
| High Computational Cost | Limits system size and simulation timescale; restricts sampling | GPU acceleration, Machine learning potentials, Cloud computing [15] [16] |
| Force Field Accuracy | Affects reliability of simulation results, especially for novel molecules | Integration of quantum mechanics (QM/MM), Machine learning-derived force fields [13] [16] |
| Limited Sampling of Rare Events | Incomplete understanding of slow biological processes (e.g., protein folding) | Enhanced sampling methods, Markov state models [12] [16] |
| Bridging Scales | Difficulty connecting atomic-level events to cellular phenomena | Multiscale modeling, Coarse-graining methods [13] |
Machine Learning Integration
The integration of machine learning and artificial intelligence with MD simulations represents one of the most promising future directions [13] [16]. Machine learning algorithms can speed up MD simulations by providing more accurate predictions of molecular interactions without relying solely on traditional force fields [16]. AI-driven approaches can also discover new force fields or optimize simulation parameters, significantly improving both speed and accuracy [16]. This integration is expected to dramatically accelerate progress in this evolving field [13].
Quantum Mechanics and Multi-Scale Modeling
Recent advancements in hybrid methods that combine quantum mechanics with classical MD (QM/MM methods) have shown promise in studying complex systems such as enzyme catalysis, where electronic structure effects play a critical role [16]. Additionally, researchers are increasingly using MD to study complex materials, including nanomaterials and soft matter systems, with applications expanding to biomaterials design for medical devices or drug delivery systems [16].
Molecular dynamics simulations have truly evolved from picosecond curiosities to millisecond-scale biological observatories, faithfully serving as computational microscopes that reveal the intricate dynamics of molecular life. This journey has been propelled by remarkable advances in computing hardware, particularly GPU technology, sophisticated software packages, and increasingly accurate physical models. As MD simulations continue to bridge the gap between computational models and actual cellular conditions, their role in drug discovery and development becomes increasingly indispensable. With the ongoing integration of machine learning, quantum mechanics, and enhanced sampling techniques, MD simulations are poised to remain at the forefront of computational biochemistry, providing unprecedented insights into molecular mechanisms and driving therapeutic innovation for years to come.
Molecular dynamics (MD) serves as a computational microscope, allowing researchers to observe the detailed motion and interactions of biological molecules at an atomic level. This guide details the core workflow, from an initial protein structure to a production MD simulation, providing the framework for understanding dynamic processes that are often inaccessible through experimental methods alone [19] [20].
The journey of an MD simulation involves three critical, sequential stages, each with distinct objectives and outputs that feed into the next. The entire process transforms a static protein structure into a dynamic trajectory that captures its motion over time.
Stage A: System Setup
The setup phase prepares the protein for simulation by embedding it in a realistic molecular environment and ensuring the system is physically stable.
Structure Preparation and Force Field Selection
The basic ingredient for MD is a protein structure file, typically in PDB format [19]. The initial structure requires preprocessing, which includes adding missing hydrogen atoms and may involve removing crystallographic water molecules or separately defining ligands not recognized by the MD software [19]. A critical early choice is the force field, which describes the physical system as collections of atoms held together by interatomic forces [19]. Using the Gromacs pdb2gmx command is a common approach:
This command generates the molecular topology (.top) and a software-specific coordinate file (.gro) [19].
Solvation and Neutralization
To mimic a physiological environment, the protein is placed in a box of explicit solvent molecules [19]. Periodic Boundary Conditions (PBC) are applied to the simulation box to minimize edge effects on surface atoms [19]. The system is then solvated, and counterions are added to neutralize its overall net charge, which is essential for simulation stability [19]. The topology file is automatically updated to include the added solvent and ions [19].
Energy Minimization and Equilibration
Before data collection, the system must be relaxed. Energy minimization removes any steric clashes or unrealistic geometry introduced during setup. This is followed by equilibration, a short simulation where the system is stabilized at the desired temperature and pressure. This step ensures the system has reached a realistic, stable state before commencing the production run [19].
Stage B: Production Simulation
The production run is the core data-generation step. Here, the equations of motion are solved iteratively to simulate the actual dynamics of the system. The system's coordinates and velocities are saved at regular intervals to form a trajectory, which is the primary output for all subsequent analysis [19] [20]. Recent advancements leverage high-throughput simulations to generate thousands of trajectories for machine learning analysis, creating comprehensive datasets for properties like packing density and enthalpy of mixing [21].
Stage C: Trajectory Analysis
The simulated trajectory is analyzed to compute properties and extract biological insights. Key analyses include:
- Root Mean Square Deviation (RMSD): Measures structural stability by quantifying the deviation from a reference structure over time [22] [20].
- Root Mean Square Fluctuation (RMSF): Identifies flexible regions within the protein structure [22].
- Radius of Gyration: Assesses the overall compactness of the protein [22].
- Solvent Accessible Surface Area (SASA): Measures the surface area of the protein accessible to a solvent molecule, important for understanding solvation and interactions [20].
These MD-derived properties are highly effective in predicting critical experimental parameters such as aqueous drug solubility when used as features in machine learning models [20].
The Scientist's Toolkit
The following table details the essential components required to perform an MD simulation.
| Component | Description | Function in Workflow |
|---|---|---|
| Protein Structure (PDB) [19] | 3D atomic coordinates from databases like RCSB PDB. | The initial input structure for the simulation. |
| Force Field [19] | A set of mathematical functions and parameters (e.g., GROMOS, CHARMM, AMBER). | Defines the potential energy and interatomic forces in the system. |
| MD Simulation Suite [19] [22] | Software like GROMACS or OpenMM for running simulations. | The core engine that performs the calculations and integrates the equations of motion. |
| Molecular Topology File [19] | A file (e.g., .top) describing the molecule(s), including bonds, angles, and force field parameters. |
Provides the structural and interaction rules for the system. |
| Simulation Box [19] | A defined boundary (e.g., cubic, dodecahedron) around the molecule. | Applies Periodic Boundary Conditions to avoid edge effects. |
| Explicit Solvent Model [19] | Water molecules (e.g., SPC, TIP3P) added to the box. | Mimics a physiological or specific solvent environment for the solute. |
| Counter Ions [19] | Ions (e.g., Na+, Cl-) added to the solvated system. | Neutralizes the net charge of the system for simulation stability. |
| Parameter File (.mdp) [19] | A file specifying simulation control parameters (temperature, pressure, timestep, etc.). | Defines the specific conditions and algorithms for the simulation run. |
Quantitative Simulation Parameters
The table below summarizes key quantitative parameters from MD studies, illustrating how simulation-derived data connects to experimental properties.
Table 1: Experimentally Validated MD Simulation Parameters
| Property Simulated | MD Software & Force Field | Simulation Time | Correlation with Experiment (R²) | Key Application / Insight |
|---|---|---|---|---|
| Density of Pure Solvents [21] | OPLS4 Force Field | NPT Ensemble | 0.98 | Validates simulation protocol against experimental density measurements. |
| Heat of Vaporization (ΔHvap) [21] | OPLS4 Force Field | NPT Ensemble | 0.97 | Used to predict cohesion energy and its correlation with viscosity. |
| Enthalpy of Mixing (ΔHm) [21] | OPLS4 Force Field | NPT Ensemble | 0.84 | Provides insight into solubility and phase stability of mixtures. |
| Aqueous Solubility (logS) [20] | GROMACS 5.1.1 / GROMOS 54a7 | NPT Ensemble | 0.87 (ML Model R²) | MD properties (SASA, LJ, etc.) used by ML to predict drug solubility. |
MD as a Computational Microscope
The standard MD workflow empowers researchers to use the technique as a computational microscope. By providing atomic-level spatial resolution and femtosecond temporal resolution, MD simulations reveal the dynamic processes that underlie biological function and molecular interactions [20] [21]. The workflow's power is amplified when integrated with modern data science approaches. For instance, machine learning analysis of properties derived from MD trajectories (like SASA and Coulombic interactions) can predict critical experimental outcomes such as drug solubility with high accuracy, demonstrating how MD serves as a foundational tool for in-silico discovery and design [20]. Furthermore, agentic AI systems like MDCrow are now emerging, capable of autonomously executing complex MD workflows by leveraging large language models to reason and operate specialized tools, thereby making this "computational microscope" more accessible and efficient [22].
MD in Action: Key Applications in Drug Discovery and Protein Science
The study of protein dynamics is fundamental to understanding biological function, yet observing these nanoscale, millisecond processes experimentally remains a profound challenge. Molecular dynamics (MD) simulations have emerged as a powerful "computational microscope," allowing researchers to visualize biomolecular processes at atomic resolution and with femtosecond temporal precision. This whitepaper explores how MD simulations illuminate the functional dynamics of two biologically crucial but structurally distinct systems: the giant muscle protein titin and the genome-editing complex CRISPR-Cas9. Through these case studies, we demonstrate how computational approaches reveal mechanistic insights inaccessible to experimental methods alone, providing researchers and drug development professionals with powerful tools for interrogating molecular function.
The Computational Microscope: Methodological Foundations
Molecular dynamics simulations numerically solve Newton's equations of motion for all atoms in a molecular system, generating a trajectory that depicts the system's structural evolution over time. Modern implementations harness exascale computing architectures and advanced GPU acceleration to achieve microsecond-to-millisecond timescales for systems comprising hundreds of thousands of atoms [23]. Several specialized methodologies have been developed to overcome the inherent timescale limitations of conventional MD:
Enhanced Sampling Techniques
Gaussian accelerated MD (GaMD) applies a harmonic boost potential to reduce energy barriers, enabling comprehensive sampling of conformational states without predefined reaction coordinates [23]. This method has proven particularly valuable for capturing large-scale conformational transitions in CRISPR-Cas9.
Advanced Analysis and Visualization
Trajectory maps represent a novel visualization method that transforms multidimensional simulation data into intuitive two-dimensional heatmaps. These maps display protein backbone movements during simulations, with the x-axis representing simulation time, the y-axis showing residue numbers, and color intensity indicating the magnitude of movement from starting positions [24]. This approach enables direct comparison of multiple simulations and pinpoints the timing and location of conformational events.
Multiscale and Hybrid Approaches
Quantum mechanics/molecular mechanics (QM/MM) partitions the system, treating the reactive center with quantum mechanical methods while handling the surrounding environment with classical MD. This approach is essential for studying bond formation and cleavage events, such as the DNA cleavage mechanism catalyzed by CRISPR-Cas9 [23] [25].
Table 1: Key Computational Methods for Protein Dynamics Visualization
| Method | Timescale | Spatial Resolution | Primary Applications |
|---|---|---|---|
| All-Atom MD | ns-μs | Atomic | Local flexibility, conformational dynamics |
| GaMD | μs-ms | Atomic | Large conformational transitions, rare events |
| Trajectory Maps | ns-ms | Residue-level | Visualizing backbone movements, comparing simulations |
| QM/MM | fs-ps | Electronic structure | Chemical reactions, enzymatic mechanisms |
| Graph Theory | N/A | Residue-level | Allosteric networks, signal transduction |
Case Study I: Titin - Molecular Spring of Muscle
Structural Organization and Mechanical Function
Titin, the largest known human protein (3.0-3.7 MDa), spans half the sarcomere in striated muscle, with its N-terminus anchored in the Z-disk and C-terminus in the M-line [26]. This giant molecular chain acts as a complex molecular spring that determines passive muscle elasticity and maintains sarcomeric structural integrity. Titin's chain folds into a series of approximately 300 immunoglobulin-like (Ig) and fibronectin-type (Fn3) domains, connected by flexible linkers that create a "beads-on-a-string" architecture [27].
Multiphase Elasticity Mechanism Revealed by Simulation
MD simulations have elucidated the hierarchical mechanism of titin's elasticity, which proceeds through distinct phases under increasing tension:
Phase 1: Domain straightening - At low forces, the flexible linkers between Ig/Fn3 domains straighten, allowing reversible extension without domain unfolding [26]. The persistence length (Lp) of monomeric titin is estimated at 9-19 nm, reflecting significant bending flexibility at physiological forces [26].
Phase 2: PEVK extension - The proline-glutamate-valine-lysine (PEVK) rich region, a largely disordered segment, unfolds under moderate tension, providing substantial contour length increase [27].
Phase 3: Domain unfolding - At high forces, individual Ig domains unravel, a process thought to occur primarily under pathological conditions [26].
Table 2: Titin Elastic Elements and Their Properties
| Elastic Element | Structural Characteristics | Mechanical Response | Contribution to Elasticity |
|---|---|---|---|
| Immunoglobulin Domains | β-sandwich folds, ~4 nm length | Hinge bending, domain unfolding | Short-range elasticity, overextension protection |
| Fibronectin Domains | β-sandwich folds, found in A-band | Bending, interaction with thick filament | Structural stability |
| PEVK Region | Disordered, proline-rich | Unfolding and extension | Intermediate elasticity |
| N2-B Unique Sequence | Differentially expressed in cardiac titin | Unknown | Tissue-specific elasticity |
Experimental and Computational Protocols
Sample Preparation: Purified titin molecules can be visualized via electron microscopy with metal shadowing or negative staining, revealing strings ~1 μm long and 4 nm in diameter [26].
Simulation Setup: All-atom MD simulations of titin fragments require:
- System Construction: Building multidomain constructs (e.g., 6 Ig domains from PDB 3b43) in explicit solvent [27]
- Force Field Selection: Specialized force fields (CHARMM36, AMBER) parameterizing Ig domain interactions
- Equilibration Protocol: Gradual relaxation of positional restraints on protein atoms
- Production Simulation: Multi-nanosecond to microsecond trajectories using GPU-accelerated codes
Analysis Methods: Persistence length calculations from end-to-end distance fluctuations; contact map analysis for interdomain interactions; force-probe simulations for mechanical unfolding.
Case Study II: CRISPR-Cas9 - Genome Editing Dynamics
Conformational Activation Pathway
CRISPR-Cas9, the revolutionary genome-editing tool, undergoes extensive conformational changes during its functional cycle. MD simulations have been instrumental in mapping these dynamics, particularly the transition from DNA recognition to catalytic activation [23].
RNA Recruitment: GaMD simulations revealed that Cas9's recognition lobe (Rec) undergoes large-scale conformational changes upon RNA binding, with Rec1-3 domains moving in opposed directions to create a positively charged RNA-binding cavity [23]. A critical intermediate state features an arginine-rich helix that facilitates guide RNA recruitment.
DNA Recognition and Activation: Upon PAM (protospacer adjacent motif) recognition, Cas9 matches the guide RNA with the target DNA strand, displacing the non-target strand (NTS). MD simulations demonstrated that NTS binding within the RuvC groove facilitates HNH domain docking at the cleavage site [23].
Catalytic Complex Formation: The highly flexible HNH domain samples multiple conformational states before adopting the active configuration. Enhanced simulations identified a thermodynamically stable active conformation later confirmed by cryo-EM structures (RMSD 2.47±0.14 Å) [23].
Allosteric Regulation and Off-Target Mechanisms
MD simulations have provided crucial insights into two critical aspects of CRISPR-Cas9 function:
Allosteric Network: Graph theory analysis of MD trajectories revealed that PAM binding induces population shifts and highly coupled motions between spatially distant HNH and RuvC catalytic domains [23] [25]. The L1/L2 loops act as "signal transducers" in this allosteric network, with mutations in these regions (e.g., eCas9, HypaCas9) improving specificity.
Off-Target Effects: Simulations introducing base pair mismatches in the RNA:DNA hybrid revealed that DNA unwinding is the primary determinant of Cas9 activity [23]. Off-target binding occurs through a kinetic competition between R-loop formation and collapse, with mismatches creating energy barriers to R-loop expansion [28].
Table 3: Key CRISPR-Cas9 Dynamics Revealed by Computational Methods
| Process | Computational Method | Key Findings | Experimental Validation |
|---|---|---|---|
| RNA Binding | GaMD, Essential Dynamics | Rec lobe opening; arginine-rich helix recruitment | Mutational studies confirming role of bridging helix [23] |
| HNH Activation | GaMD, Long-timescale MD | Rec2-3 domain opening enables HNH docking | Cryo-EM structure of active state [23] |
| Allosteric Regulation | Graph Theory, Correlation Analysis | PAM as allosteric effector; L1/L2 as signal transducers | Specificity-enhanced variants (eCas9, HypaCas9) [23] |
| Off-target Effects | Mismatch Simulations, Random Walk Modeling | DNA unwinding as key determinant; kinetic competition mechanism | Single-molecule FRET experiments [28] |
| Catalytic Mechanism | QM/MM | Two-metal mechanism for RuvC; single-metal for HNH | Biochemical studies of metal dependence [25] |
Experimental and Computational Protocols
Single-Molecule DNA Twist Experiments:
- Sample Preparation: DNA molecules surface-grafted and tethered to magnetic beads
- Data Acquisition: Magnetic tweezers apply negative supercoiling while monitoring DNA length changes proportional to R-loop formation [28]
- Analysis: Dwell times of intermediate R-loops quantified to determine kinetics
Random Walk Modeling of R-loop Dynamics:
- Landscape Construction: One-dimensional free energy landscape with R-loop length as reaction coordinate
- Parameterization: Free energy penalties for initiation (ΔGini), locking (ΔGlock), supercoiling bias (ΔGbias), and mismatches (ΔGMM)
- Kinetic Modeling: Single base-pair stepping rates (kstep) with Arrhenius treatment of biased transitions [28]
Enhanced Sampling Simulations:
- System Setup: All-atom models of Cas9 with guide RNA and target DNA in explicit solvent
- GaMD Protocol: Application of harmonic boost potential to system potential energy
- Trajectory Analysis: Free energy landscape reconstruction using simulated trajectories
Table 4: Key Research Reagents and Computational Tools
| Resource | Type | Function/Application | Access/Implementation |
|---|---|---|---|
| GROMACS | Software | Molecular dynamics simulation package | Open source (www.gromacs.org) |
| AMBER | Software | Molecular dynamics simulation & analysis | Commercial & academic licensing |
| Mol* | Visualization Tool | Web-based 3D visualization of large biomolecular structures | Open source (molstar.org) |
| TrajMap.py | Analysis Tool | Python script for generating trajectory maps from MD simulations | Open source Python script [24] |
| CHARMM36 | Force Field | Parameters for biomolecular simulations | Bundled with simulation packages |
| Cascade Complex | Protein Reagent | CRISPR surveillance complex for single-molecule studies | Recombinant expression [28] |
| Magnetic Tweezers | Instrument | Single-molecule manipulation and supercoiling measurements | Custom-built or commercial systems |
Molecular dynamics simulations have fundamentally transformed our ability to visualize and understand protein function, serving as a powerful computational microscope that reveals biological mechanisms at unprecedented spatial and temporal resolution. Through the case studies of titin and CRISPR-Cas9, we have demonstrated how MD simulations provide unique insights into conformational dynamics, allosteric regulation, and functional mechanisms. For titin, simulations have elucidated the hierarchical multi-phase elasticity that enables its function as a molecular spring in muscle. For CRISPR-Cas9, computational methods have mapped the complete activation pathway, revealed the allosteric networks governing specificity, and provided mechanistic understanding of off-target effects. As MD methodologies continue to advance, integrating with machine learning approaches and exploiting exascale computing resources, the resolving power of this computational microscope will only increase, offering drug development professionals and researchers ever more detailed views of the molecular machinery underlying health and disease.
Molecular dynamics (MD) simulations have emerged as a powerful "computational microscope," enabling researchers to probe the atomic-level dynamics of biomolecular systems critical to drug discovery [3] [29]. By simulating the jiggling and wigglings of atoms over time, MD provides insights into protein flexibility, binding site identification, and ligand energetics that are often inaccessible through experimental methods alone [29]. This technical guide explores how MD serves as this computational microscope, bridging the gap between static structural data and the dynamic reality of molecular interactions.
The Computational Microscope: Visualizing Molecular Motion
The fundamental power of MD simulations lies in their ability to extend static structural data into the dynamic domain, creating detailed "movies" of biomolecular behavior [3]. Unlike traditional molecular docking, which typically treats proteins as rigid entities, MD accounts for full flexibility, sampling conformational states and revealing transient binding pockets crucial for drug design [30] [29].
- From Static Structures to Dynamic Ensembles: MD simulations transform single, static protein structures into ensembles of conformations, capturing the intrinsic flexibility that characterizes functional biomolecules. This is particularly valuable for identifying cryptic pockets—transient binding sites not visible in crystallographic structures that emerge during protein dynamics [30].
- Physical Basis: MD simulations employ Newtonian physics to simulate atomic motions, using force fields (AMBER, CHARMM, GROMOS) to calculate forces between atoms [29]. These calculations advance the system in femtosecond to picosecond timesteps, ultimately generating trajectories that capture complex biomolecular processes.
- Validation: The accuracy of the computational microscope is supported by strong agreement with experimental data, particularly NMR measurements of molecular dynamics [29].
Enhanced Sampling Methods for Identifying Binding Sites
Conventional MD simulations face limitations in crossing substantial energy barriers within practical simulation timescales. Enhanced sampling methods address this challenge by smoothing the potential energy landscape, enabling more thorough exploration of conformational space [30].
Accelerated Molecular Dynamics (aMD) and Gaussian Accelerated MD (GaMD)
These methods apply a boost potential to the system's energy surface, reducing energy barriers and accelerating transitions between low-energy states [30].
- Implementation: A positive boost potential is added to the system when the potential energy falls below a reference energy, decreasing the effective height of energy barriers [31].
- Ligand GaMD (LiGaMD): This extension applies a selective boost to ligand nonbonded potential energy, particularly enhancing sampling of ligand binding and dissociation events [31]. LiGaMD2 further refines this approach by applying boost potential to both the ligand and protein residues around the binding pocket [31].
- Performance: GaMD simulations can capture repetitive ligand binding and unbinding events within microsecond timescales, allowing simultaneous characterization of binding thermodynamics and kinetics [31].
The Relaxed Complex Scheme
This systematic approach leverages MD-generated conformational ensembles for docking studies, addressing the critical limitation of protein flexibility in traditional structure-based drug design [30].
Workflow of the Relaxed Complex Scheme
This method successfully contributed to the development of the first FDA-approved inhibitor of HIV integrase, where MD simulations revealed significant flexibility in the active site region that informed drug design [30].
Predicting Ligand Binding Energetics
Accurate prediction of binding free energies remains a central challenge in structure-based drug design. MD-based approaches span a spectrum of rigor and computational cost, from end-state methods to alchemical techniques [32].
Alchemical Free Energy Calculations
These theoretically rigorous methods compute absolute binding free energies by coupling/decoupling the ligand from its environment in the bound and unbound states [32] [33].
- Mathematical Foundation: Alchemical methods evaluate ratios of partition functions to estimate binding free energies, including entropic contributions and full molecular flexibility [32].
- Absolute vs Relative: Absolute binding free energy (ABFE) calculations decouple the entire ligand from both protein and solvent environments, while relative binding free energy (RBFE) calculations transform one ligand to another, requiring less sampling but needing reference compounds [33].
Performance of Free Energy Methods on Model Systems
| Methodology | System Tested | RMS Error (kcal/mol) | Key Advancement |
|---|---|---|---|
| Traditional Docking | T4 Lysozyme L99A | Not quantified (poor correlation R=0.51) | Ligand flexibility only [32] |
| Alchemical Free Energy (Single Pose) | T4 Lysozyme L99A | 3.51 ± 0.04 | Includes entropic effects but limited pose sampling [32] |
| Alchemical Free Energy (Multiple Poses) | T4 Lysozyme L99A | 1.9 | Accounts for symmetry-equivalent orientations [32] |
| Prospective Alchemical Prediction | T4 Lysozyme L99A | 0.6 (blind test) | Correct discrimination of true ligands vs decoys [32] |
| Equilibrium FEP with HREX | BRD4(1) inhibitors | 0.8 | Enhanced sampling protocol [33] |
| Non-equilibrium FEP | BRD4(1) inhibitors | Comparable to equilibrium | Bi-directional transitions [33] |
Equilibrium vs. Non-Equilibrium Approaches
Recent advances have demonstrated that both equilibrium and non-equilibrium approaches can achieve comparable accuracy when properly implemented [33].
- Equilibrium FEP: Simulations are run at discrete λ values connecting bound and unbound states, with free energy differences computed using Bennett's Acceptance Ratio or Multistate BAR [33].
- Non-Equilibrium FEP: Rapid transitions drive the system between states, with work values collected and free energies recovered using Jarzynski's equality (uni-directional) or the Crooks Fluctuation Theorem (bi-directional) [33].
- Optimal Parameters: For absolute binding free energies, transition times of 500 ps provide sufficient work distribution overlap for reliable estimates [33].
Free Energy Calculation Workflow Comparison
Integrated Workflows and Protocols
Combining enhanced sampling with free energy calculations creates powerful protocols for drug discovery applications.
Exemplary Protocol: Binding Site Identification and Energetics
System Preparation
- Obtain protein structure from PDB or AlphaFold prediction [30]
- Parameterize ligands using appropriate force fields
- Solvate system in explicit water molecules and add ions for physiological concentration
Enhanced Sampling Simulation
- Run GaMD or LiGaMD simulation for 100-500 ns to explore conformational space [31]
- Identify cryptic pockets through volume analysis of trajectory
- Cluster structures to identify representative conformations
Binding Pose Characterization
- Use the Relaxed Complex Scheme to dock ligands against MD-derived conformations [30]
- Run short MD simulations (10-20 ns) to refine poses
- Identify stable binding modes for free energy calculations
Free Energy Calculation
- Set up alchemical transformation for absolute binding free energy
- Use 20-30 λ windows for equilibrium FEP or 500+ non-equilibrium transitions [33]
- Employ Hamiltonian replica exchange to enhance sampling between windows
- Compute binding free energy using BAR or Crooks Fluctuation Theorem
The Researcher's Toolkit: Essential Computational Reagents
Table: Key Methodologies and Their Applications in MD-Driven Drug Discovery
| Methodology | Primary Function | Key Advantages | Representative Software |
|---|---|---|---|
| GaMD/LiGaMD | Enhanced sampling of binding events | Captures full binding/dissociation events; Improves kinetics estimation | AMBER, NAMD [31] |
| Alchemical FEP | Binding free energy prediction | Rigorous statistical mechanics foundation; High accuracy when converged | CHARMM, GROMACS, SOMD [32] [33] |
| Relaxed Complex Scheme | Binding site identification | Accounts for protein flexibility; Identifies cryptic pockets | AutoDock, Vina with MD trajectories [30] |
| Coarse-Grained MD | Extended timescale sampling | Reduces computational cost; Enables millisecond sampling | Martini [34] |
| Non-equilibrium FEP | Binding free energy prediction | Computational efficiency; Bi-directional validation | Custom implementations [33] |
Future Perspectives
The field of MD-driven drug discovery continues to evolve rapidly, with several emerging trends promising to enhance both the accuracy and scope of the computational microscope.
- Integration with Machine Learning: Combining MD with AI approaches is expected to improve force fields, sampling efficiency, and binding affinity predictions [35] [30].
- Coarse-Grained Methods: Approaches like coarse-grained funnel metadynamics bridge the gap between all-atom accuracy and computational efficiency, showing comparable results to all-atom methods at reduced cost [34].
- Specialized Hardware: Dedicated processors like Anton and GPU acceleration are extending accessible timescales, with millisecond simulations now possible for some systems [29].
- Force Field Refinement: Development of polarizable force fields that account for electronic polarization will improve accuracy, particularly for charged systems and metal ions [29].
As these methodologies mature, molecular dynamics as a computational microscope will play an increasingly central role in accelerating drug discovery, from initial target identification to lead optimization, ultimately reducing the time and cost associated with bringing new therapeutics to market.
Molecular dynamics (MD) simulation has emerged as a powerful computational microscope, enabling researchers to observe and manipulate molecular systems at spatial and temporal scales often inaccessible to conventional experimental techniques. By providing atomic-level resolution of drug-carrier interactions, stability, and release mechanisms, MD serves as a vital bridge between theoretical design and experimental implementation in drug delivery optimization. This computational approach offers unprecedented insights into the dynamic behavior of nanocarriers and their payloads under biologically relevant conditions, allowing researchers to overcome the limitations of traditional resource-intensive experimental methods [36]. The framework of MD simulations facilitates the detailed examination of molecular mechanisms influencing drug behavior, effectively serving as a virtual laboratory for testing and optimizing next-generation drug delivery systems for cancer therapy and other applications [36].
Fundamental Principles of MD in Drug Delivery
Theoretical Foundations
Molecular dynamics simulations operate on principles of statistical mechanics, numerically solving Newton's equations of motion for all atoms within a molecular system. This approach generates trajectories that reveal time-dependent evolution of molecular configurations, providing insights into structural stability, binding affinities, and dynamic interactions critical for drug delivery optimization. The atomic-level resolution offered by MD enables researchers to predict how nanocarriers encapsulate therapeutic agents, how these complexes maintain stability in biological environments, and how controlled release occurs at target sites [36].
The power of MD as a computational microscope lies in its ability to capture transient molecular states and interaction mechanisms that often elude experimental detection. By applying empirical force fields that describe potential energy surfaces based on nuclear positions, MD simulations can model systems ranging from simple drug molecules in solution to complex heterogeneous environments involving nanocarriers, membranes, and biological fluids [5]. Recent advances in high-performance computing have extended these simulations to biologically relevant timescales and system sizes, enabling the study of increasingly complex delivery systems with millions to billions of atoms [5].
Simulation Workflows for Drug Delivery Systems
The typical workflow for MD simulations in drug delivery applications follows a structured approach from system construction to analysis. Figure 1 illustrates this generalized workflow, highlighting the key stages researchers employ to optimize nanocarrier formulations.
Figure 1: Generalized workflow for MD simulations of drug delivery systems, illustrating the sequential steps from initial system setup to final analysis and validation.
This workflow begins with system setup, where researchers construct atomic models of nanocarriers and drug molecules based on experimental data or computational predictions. For cancer therapeutics specifically, common simulated drugs include Doxorubicin (DOX), Gemcitabine (GEM), and Paclitaxel (PTX), which are studied in conjunction with various nanocarriers [36]. The subsequent solvation and neutralization stage places the drug-carrier system in a biologically relevant environment, typically employing water models such as TIP3P or SPC/E and adding ions to achieve physiological concentration and neutrality.
Energy minimization follows, removing steric clashes and unfavorable interactions through algorithms like steepest descent or conjugate gradient methods. Equilibration then brings the system to target temperature and pressure using thermostats (e.g., Nosé-Hoover) and barostats (e.g., Parrinello-Rahman). Production simulation, the core of the MD process, collects trajectory data for analysis over timescales ranging from nanoseconds to microseconds, depending on system size and computational resources. Finally, trajectory analysis extracts meaningful physicochemical properties and validation compares computational predictions with experimental observations [36] [5].
Key Nanocarrier Systems Simulated via MD
Carbon-Based Nanocarriers
Carbon nanotubes (CNTs), particularly functionalized carbon nanotubes (FCNTs) and double-walled carbon nanotubes (DWCNTs), have demonstrated exceptional potential as drug delivery vehicles in MD simulations. These systems exhibit high drug-loading capacity and structural stability, making them particularly suitable for protecting therapeutic compounds from degradation and facilitating targeted delivery [36].
A recent study investigating the anticancer drug ZD1694 (Tomudex) encapsulated within seven layers of DWCNTs revealed remarkable protective capabilities. The research demonstrated that DWCNT shielding significantly reduced molecular deformation under mechanical pressure from a gold tip, with a substantial decrease in mean squared displacement (0.872 Ų) compared to unshielded configurations (2.39 Ų) [37]. This enhanced stability directly translates to improved drug integrity during delivery. Furthermore, the DWCNT-shielded system exhibited dramatically improved mechanical properties, with a 10.85-fold increase in elastic modulus (3.17 × 10⁻² GPa) and a 10.83-fold increase in shear modulus (4.76 × 10⁻² GPa) compared to the non-shielded system [37].
Lipid and Polymer-Based Systems
Lipid-based nanocarriers represent another major category extensively studied through MD simulations. Liquid crystalline nanoparticles (LCNPs), including hexosomes, have shown particular promise for enhancing drug absorption, solubility, and chemical stability [38]. All-atom MD simulations of hexagonal liquid crystalline phases composed of phytantriol and farnesol (90:10 ratio) have provided molecular-level insights into drug partitioning and release mechanisms [38].
These simulations demonstrated that highly lipophilic drugs like clarithromycin predominantly associate with the lipid phase, while drugs with both hydrophobic and hydrophilic residues, such as vancomycin, tend to localize at the water-lipid interface, interacting with both phases [38]. The incorporation of Pluronic F127 polymers at the hexosomal interface further modified release kinetics by facilitating water permeation and reducing energy barriers for drug release, as confirmed by umbrella sampling simulations and in vitro release studies [38].
Additional nanocarrier systems successfully characterized through MD simulations include chitosan-based nanoparticles, metal-organic frameworks (MOFs), and human serum albumin (HSA) carriers, each offering distinct advantages in biodegradability, reduced toxicity, and controlled release profiles [36].
Table 1: Key Nanocarrier Systems Studied via MD Simulations
| Nanocarrier Type | Key Advantages | Representative Drugs | Simulation Insights |
|---|---|---|---|
| Functionalized Carbon Nanotubes (FCNTs) | High drug-loading capacity, stability | Doxorubicin, Gemcitabine | Enhanced encapsulation efficiency, controlled release mechanisms [36] |
| Double-Walled Carbon Nanotubes (DWCNTs) | Superior shielding, mechanical strength | ZD1694 (Tomudex) | Reduced molecular deformation (MSD: 0.872 Ų), improved elastic modulus (3.17×10⁻² GPa) [37] |
| Liquid Crystalline Nanoparticles | Enhanced absorption, tunable solubility | Vancomycin, Clarithromycin | Drug partitioning based on lipophilicity, polymer-facilitated release [38] |
| Chitosan-Based Nanoparticles | Biodegradability, reduced toxicity | Paclitaxel, Doxorubicin | Molecular-level understanding of mucoadhesion, controlled release [36] |
| Human Serum Albumin (HSA) | Biocompatibility, natural targeting | Various anticancer agents | Drug-binding mechanisms, stability in physiological conditions [36] |
Critical Characterization Parameters and Methods
Structural and Dynamic Properties
MD simulations enable the calculation of essential structural and dynamic properties that predict nanocarrier performance in biological systems. These parameters include radial distribution functions (RDF) that reveal spatial atomic organization and interaction sites, mean squared displacement (MSD) that quantifies particle mobility and diffusion coefficients, and various energy profiles that determine system stability and interaction strengths [37].
Umbrella sampling simulations, a specialized MD technique, provide particularly valuable insights into drug release mechanisms by calculating potential of mean force (PMF) along specified reaction coordinates. This approach was effectively employed in studying drug release from hexagonal liquid crystalline phases, where energy profiles revealed that polymer-lipid-water interactions at the interface reduce energy barriers for drug release [38]. The simulations demonstrated that vancomycin, with its lower energy barrier, exhibited higher release compared to clarithromycin, findings subsequently confirmed through in vitro release studies [38].
Physicochemical Characterization
The physicochemical properties of nanocarriers significantly influence their bioavailability, stability, cellular uptake, and biodistribution [39]. MD simulations provide atomic-level data on these critical parameters, complementing experimental characterization techniques. Key properties include particle size and size distribution, surface charge (zeta potential), hydrophobicity, and morphological characteristics [39].
Figure 2 illustrates the relationship between key characterization parameters and their impact on nanocarrier performance, highlighting how MD simulations connect molecular-level properties to macroscopic behavior.
Figure 2: Relationship between molecular properties derived from MD simulations and key performance metrics for nanocarrier drug delivery systems.
Particle size and shape profoundly affect biodistribution, elimination, cellular uptake, and endocytosis mechanisms [39]. Similarly, surface charge (zeta potential) indicates potential electrostatic interactions between nanocarrier units, influences aggregation tendencies, and informs the selection of appropriate coating materials [39]. MD simulations can predict所有这些 properties under various physiological conditions, providing insights that guide nanocarrier design and optimization.
Table 2: Key Characterization Parameters for Nanocarrier Systems
| Parameter Category | Specific Metrics | Computational Methods | Biological Significance |
|---|---|---|---|
| Structural Properties | Radial Distribution Function (RDF), Gyration Radius, Contact Maps | MD trajectory analysis, Neighborhood analysis | Molecular organization, complex stability, interaction sites [37] |
| Dynamic Properties | Mean Squared Displacement (MSD), Diffusion Coefficients, Principal Component Analysis | Einstein relation, Covariance matrix analysis, Domain motion identification | Particle mobility, system flexibility, functional motions [37] |
| Energetic Properties | Binding Free Energy, Potential of Mean Force (PMF), Interaction Energies | Umbrella Sampling, MM/PBSA, Thermodynamic Integration | Drug-carrier affinity, release barriers, complex stability [38] |
| Physicochemical Properties | Solvent Accessible Surface Area, Hydrogen Bonding, Hydration Properties | Geometric calculations, Donor-acceptor analysis, Spatial density maps | Solubility, aggregation propensity, in vivo behavior [39] |
Experimental Protocols and Methodologies
Protocol 1: Drug Encapsulation and Stability Assessment
This protocol outlines the procedure for evaluating drug encapsulation efficiency and stability within carbon nanotube-based carriers, based on methodologies employed in recent studies of DWCNT-anticoncer drug complexes [37].
System Setup:
- Construct atomic models of double-walled carbon nanotubes (DWCNTs) with appropriate chirality and dimensions
- Model anticancer drug molecules (e.g., ZD1694/Tomudex) using quantum chemical calculations for partial charge assignment
- Assemble the encapsulation system with drug molecules positioned inside the seven-layer DWCNT structure
- Solvate the system with explicit water molecules (TIP3P water model) and add ions to achieve physiological concentration (0.15 M NaCl)
Simulation Parameters:
- Employ all-atom force fields (CHARMM36 or AMBER) for biological systems
- Use periodic boundary conditions in all directions
- Apply particle-mesh Ewald method for long-range electrostatic interactions
- Set non-bonded cutoff distance to 12 Å with switching function starting at 10 Å
- Maintain constant temperature (310 K) using Nosé-Hoover thermostat and pressure (1 atm) using Parrinello-Rahman barostat
Production Simulation and Analysis:
- Conduct production runs for minimum 100-200 ns in triplicate with different initial velocities
- Calculate radial distribution function (RDF) between drug atoms and CNT layers to quantify spatial organization
- Compute mean squared displacement (MSD) of drug molecules to assess mobility and confinement effects
- Perform essential dynamics analysis to identify collective motions associated with drug release
- Calculate interaction energies between drug and carrier through MM/PBSA approaches
Protocol 2: Drug Release Kinetics from Liquid Crystalline Systems
This protocol describes the methodology for investigating drug partitioning and release mechanisms from hexagonal liquid crystalline phases, adapted from studies of phytantriol-based nanocarriers [38].
System Construction:
- Build atomic model of hexagonal phase with phytantriol:farnesol (90:10 ratio) lipid composition
- Incorporate drug molecules (vancomycin and clarithromycin) at different locations within the system
- Add Pluronic F127 polymers at the interface to model surface modification effects
- Hydrate the system with varying water-to-lipid ratios to assess hydration effects on structure
Equilibration and Sampling:
- Perform gradual equilibration starting from pre-assembled structures
- Conduct constrained simulations to maintain phase integrity during initial equilibration
- Implement umbrella sampling simulations along reaction coordinates defining drug release pathway
- Use 20-30 sampling windows with harmonic restraints (force constant 20-50 kcal/mol/Ų)
- Run each window for 20-50 ns to ensure proper convergence of free energy estimates
Analysis Methods:
- Calculate potential of mean force (PMF) using weighted histogram analysis method (WHAM)
- Determine drug partition coefficients between lipid and aqueous phases
- Analyze hydrogen bonding patterns and lipid ordering around drug molecules
- Quantify polymer-lipid interactions and their effect on interface properties
- Correlate simulation findings with in vitro release studies for validation
The Scientist's Toolkit: Essential Research Reagents and Materials
Table 3: Essential Research Reagents and Computational Tools for MD Simulations of Nanocarriers
| Category | Specific Items | Function/Purpose | Examples/Alternatives |
|---|---|---|---|
| Nanocarrier Components | Functionalized Carbon Nanotubes (FCNTs) | High drug-loading capacity, stability | Single-walled, double-walled CNTs [36] [37] |
| Liquid Crystalline Lipids | Enhanced absorption, tunable release | Phytantriol, farnesol mixtures [38] | |
| Biocompatible Polymers | Surface modification, stealth properties | Pluronic F127, chitosan, HSA [36] [38] | |
| Therapeutic Agents | Anticancer Drugs | Model payloads for delivery studies | Doxorubicin, Gemcitabine, Paclitaxel, ZD1694 [36] [37] |
| Antibiotic Compounds | Partitioning and release studies | Vancomycin, Clarithromycin [38] | |
| Simulation Tools | Molecular Dynamics Software | Running simulations, trajectory generation | GROMACS, NAMD, AMBER, CHARMM [5] |
| Force Fields | Defining molecular interactions | CHARMM36, AMBER, OPLS-AA [37] [38] | |
| Analysis Packages | Trajectory processing, property calculation | MDAnalysis, VMD, PyTraj [5] | |
| Validation Methods | In Vitro Release Systems | Experimental confirmation of predictions | Dialysis membranes, Franz cells [38] |
| Characterization Instruments | Physicochemical property measurement | DLS, AFM, TEM, SEM [39] |
Current Challenges and Future Perspectives
Despite significant advances, several challenges remain in the application of MD simulations to drug delivery optimization. The computational complexity of these simulations presents substantial hurdles, particularly when studying large nanocarrier systems over biologically relevant timescales [36]. The massive amounts of data generated by hundreds to thousands of simulation trajectories create additional processing and visualization challenges [5].
Future progress will likely stem from advances in several key areas. High-performance computing infrastructures continue to evolve, enabling longer timescales and larger systems [36] [5]. Machine learning techniques are being integrated to accelerate simulations, analyze complex datasets, and predict molecular properties with reduced computational expense [36]. Advanced visualization methods, including virtual reality environments and web-based tools, are improving researchers' ability to interpret complex simulation data [5]. Multi-scale modeling approaches that combine quantum mechanical, molecular mechanical, and coarse-grained methods will provide comprehensive insights across different spatial and temporal resolutions [5].
The ongoing integration of MD simulations with experimental validation creates a powerful feedback loop for accelerating nanocarrier development. As computational capabilities continue to advance, MD will increasingly serve as an indispensable computational microscope, providing deeper molecular insights and guiding the rational design of next-generation drug delivery systems with optimized efficacy, specificity, and safety profiles.
Molecular dynamics (MD) simulations have revolutionized molecular biology by acting as a computational microscope, allowing researchers to visualize the dynamic motion of atoms and molecules with unprecedented detail [1]. This powerful tool has deepened our understanding of critical biological processes—from protein folding and protein-drug binding to complex protein-protein interactions—that often prove difficult to probe experimentally [1]. However, a significant limitation has constrained its full potential: the dramatic disparity between the timescales accessible to conventional MD and those governing essential biological functions. While critical biochemical processes occur over milliseconds or longer, even state-of-the-art supercomputers typically enable MD simulations to reach only microsecond to millisecond timescales [3] [1]. This gap arises because biomolecules navigate rough energy landscapes with many local minima separated by high-energy barriers, making it computationally prohibitive to sample rare but biologically crucial transitions with conventional methods [40].
Enhanced sampling techniques have emerged to address this fundamental challenge. Among these, Gaussian accelerated Molecular Dynamics (GaMD) has gained prominence for its ability to accelerate molecular dynamics simulations thousands to millions of times, effectively bridging the temporal divide [1]. By smoothing the potential energy surface and reducing energy barriers, GaMD and similar methods transform the computational microscope from a tool capturing limited snapshots into one capable of recording full molecular feature films, providing biologists and drug developers with powerful insights previously beyond reach [1].
Theoretical Foundations of GaMD
Basic Principles and Algorithm
Gaussian accelerated Molecular Dynamics (GaMD) is an enhanced sampling technique that improves conformational space exploration by applying a harmonic boost potential to smooth the biomolecular energy landscape [41]. This approach accelerates simulations by lowering energy barriers, thereby facilitating transitions between conformational states that would be rare events in conventional MD [42]. The core innovation of GaMD lies in its boost potential, which follows a Gaussian distribution, enabling more accurate recovery of the original free energy landscape through reweighting compared to its predecessor, accelerated MD (aMD) [41].
The mathematical foundation of GaMD is encapsulated in the boost potential ΔV(r), which is applied only when the system's potential energy V(r) falls below a specified threshold energy E:
[ \Delta V(\vec{r}) = \frac{1}{2} k (E - V(\vec{r}))^2 ]
where k is the harmonic force constant. The modified potential energy of the system becomes:
[ V^*(\vec{r}) = V(\vec{r}) + \Delta V(\vec{r}) ]
This boost potential is applied conditionally:
[ \Delta V(\vec{r}) = \begin{cases} \frac{1}{2} k (E - V(\vec{r}))^2 & V(\vec{r}) < E \ 0 & V(\vec{r}) \geq E \end{cases} ]
The threshold energy E can be set using two primary approaches: the "upper bound" E = Vmax or the "lower bound" E = Vmin + 1/k [41]. System size typically guides this choice; larger systems may require the upper bound for sufficient boosting, while most systems benefit from the lower bound to prevent excessive boost potential that could distort the energy landscape [41].
The Reweighting Process
A critical advantage of GaMD is its ability to recover the original free energy landscape through reweighting. Because the boost potential follows a near-Gaussian distribution, the unbiased probability distribution can be reconstructed using cumulant expansion to the second order [41] [43]. This "Gaussian approximation" allows for accurate calculation of free energy profiles from GaMD simulations, a significant improvement over aMD where reweighting was often dominated by statistical outliers [41].
The following diagram illustrates the complete GaMD workflow, from conventional MD through to production and analysis:
Comparative Analysis of Enhanced Sampling Methods
The field of enhanced sampling encompasses several sophisticated approaches, each with distinct strengths and limitations. Replica-exchange MD (REMD) employs parallel simulations at different temperatures, allowing exchanges between replicas based on Metropolis criteria to overcome energy barriers [40]. Metadynamics enhances sampling by adding history-dependent bias potentials along predefined collective variables (CVs) to "fill" free energy wells and push the system to explore new states [40]. Simulated annealing mimics the metallurgical process of gradual cooling, using an artificial temperature that decreases during simulation to guide the system toward low-energy states [40].
Table 1: Comparison of Major Enhanced Sampling Methods in Molecular Dynamics
| Method | Core Principle | Collective Variables (CVs) Required? | Key Advantages | Key Limitations |
|---|---|---|---|---|
| GaMD | Applies Gaussian-distributed boost potential to smooth energy landscape | No (unconstrained) | No predefined CVs needed; Accurate reweighting; Suitable for complex biomolecular transitions [41] [1] | Boost parameters need careful tuning; Complex reweighting process [41] |
| aMD | Applies continuous boost potential when system energy below threshold | No (unconstrained) | No predefined CVs needed; Faster barrier crossing [41] | Large boost potentials cause noisy reweighting; Less accurate free energy recovery [41] |
| REMD | Exchanges configurations between parallel simulations at different temperatures | No (but often used with CVs) | Effective for rough energy landscapes; Parallelizable [40] | Requires significant computational resources; Number of replicas grows with system size [40] |
| Metadynamics | Adds history-dependent bias along predefined CVs | Yes | Good for exploring specific reaction pathways; Gradually builds free energy surface [40] | Quality depends on CV choice; Risk of overfilling energy wells [40] |
| Simulated Annealing | Gradually reduces temperature during simulation | No | Effective for finding global minima; Good for flexible systems [40] | Risk of quenching in local minima; Less efficient for large systems [40] |
GaMD Specializations and Hybrid Methods
The GaMD framework has evolved to include specialized variants targeting specific biological questions. Ligand GaMD (LiGaMD) and its advanced version LiGaMD2 selectively boost ligand interactions in protein-ligand complexes, enabling efficient capture of binding and dissociation events [41]. Peptide GaMD (Pep-GaMD) focuses on highly flexible peptides, while PPI-GaMD enhances sampling of protein-protein interactions [41]. Hybrid approaches such as replica exchange GaMD (rex-GaMD) combine GaMD with replica exchange methods to further improve sampling efficiency and free energy calculations [43].
Practical Implementation of GaMD
Protocol and Workflow
Implementing GaMD requires careful preparation and execution across multiple stages. The following experimental protocol outlines the complete process for running GaMD simulations in NAMD, as detailed in recent tutorials [42] [41]:
System Preparation
- Build your molecular system using standard MD preparation tools
- Generate necessary topology and parameter files
- Solvate and add ions as needed for biological relevance
- Minimize energy and equilibrate using standard protocols
Conventional MD Simulation
- Run a conventional MD simulation (typically 50-100 ns)
- Collect statistics on potential energy: minimum (Vmin), maximum (Vmax), average (Vavg), and standard deviation (σV)
- Ensure system stability through RMSD and Rg analysis
GaMD Parameterization
- Calculate threshold energy (E) and harmonic force constant (k) from conventional MD statistics
- Choose between "upper bound" (E = Vmax) for larger systems or "lower bound" (E = Vmin + 1/k) for most applications
- Set the harmonic force constant k based on the standard deviation of the potential energy
GaMD Equilibration
- Run GaMD simulation with flexible boost parameters
- Allow the system to adapt to the boost potential
- Monitor convergence of boost parameters
GaMD Production
- Execute production simulation with fixed boost parameters
- Typically run for hundreds of nanoseconds to microseconds depending on system complexity
- Save trajectories at appropriate frequencies for analysis
Reweighting and Analysis
- Use PyReweighting toolkit to recover unbiased free energy landscapes
- Apply cumulant expansion to the second order for accurate reweighting
- Calculate free energy profiles along relevant conformational coordinates
Table 2: Essential Software and Tools for GaMD Implementation
| Tool Name | Category | Primary Function | Key Features | Availability |
|---|---|---|---|---|
| NAMD (v2.12+) | MD Engine | Running GaMD simulations | Implementation of GaMD algorithm; Scalable parallel performance [41] | Free for academic use |
| PyReweighting Toolkit | Analysis | Free energy reweighting | Calculates unbiased free energy profiles from GaMD trajectories [41] | GitHub repository |
| AMBER | MD Suite | Simulation preparation & analysis | Alternative GaMD implementation; Toolchain for analysis [41] | Commercial & free versions |
| CPPTRAJ | Analysis | Trajectory processing | Extensive analysis capabilities for MD trajectories [41] | Part of AmberTools |
| CATDCD | Utility | Trajectory manipulation | Concatenates and processes trajectory files [41] | Free download |
| Python 3.10+ | Programming | Analysis environment | Required for PyReweighting; Custom analysis scripts [41] | Open source |
Advanced Applications and Case Studies
Biomolecular Systems and Drug Design
GaMD has demonstrated particular utility in studying complex biomolecular systems that challenge conventional MD approaches. In CRISPR-Cas9 systems, GaMD simulations revealed intricate conformational transitions during nucleic acid binding and processing, predicting the structure of the active complex before experimental characterization [1]. These simulations provided unprecedented dynamic details of how the Cas9 protein interacts with DNA and RNA, offering insights critical for optimizing genome editing technologies and addressing off-target effects [1].
In drug discovery, GaMD has enabled the study of previously intractable processes. The selective Ligand GaMD (LiGaMD) method captured both binding and dissociation of inhibitors to the human angiotensin-converting enzyme 2 (ACE2), the SARS-CoV-2 receptor [1]. This application provided mechanistic insights into viral entry and facilitated rational drug design for COVID-19 therapeutics. Similarly, GaMD simulations have been used to investigate the main protease of SARS-CoV-2, identifying potential drug candidates to block viral replication [1].
Enzyme Mechanism Elucidation
A recent study on Cid1 polymerase exemplifies GaMD's power in elucidating enzymatic mechanisms [44]. Researchers employed 500 ns GaMD simulations on five systems (free-Cid1, Cid1-ATP, Cid1-UTP, Cid1-CTP, and Cid1-GTP) to understand the molecular basis of substrate selectivity. The simulations revealed that UTP formed stronger and more numerous non-covalent interactions with Cid1 compared to other substrates [44]. Molecular Mechanics Poisson-Boltzmann Surface Area (MM-PBSA) binding energy analysis showed a clear preference for UTP, followed by ATP, CTP, and GTP, explaining the enzyme's biological function as a poly(U) polymerase [44].
The following diagram illustrates the integrated workflow combining GaMD with experimental data, as demonstrated in the Cid1 polymerase study:
Methodological Advancements
The continued evolution of GaMD and other enhanced sampling methods points toward several promising directions. Integration with machine learning approaches is already showing potential, as demonstrated by workflows that bridge microscopy data with molecular dynamics simulations through neural networks [45]. The development of specialized GaMD variants continues with algorithms like LiGaMD2, which further refines ligand binding simulations by boosting protein residues with direct ligand interactions [41]. Hybrid methods that combine GaMD with other enhanced sampling techniques, such as replica exchange and weighted-ensemble approaches, offer complementary strengths that may overcome individual limitations [41] [43].
Gaussian accelerated Molecular Dynamics represents a significant advancement in the toolkit of the computational microscope, effectively bridging temporal scales that separate simulation from biological reality. By providing unconstrained enhanced sampling without requiring predefined reaction coordinates, GaMD enables the investigation of complex biomolecular processes that were previously inaccessible to computational modeling [41] [1]. Its growing adoption in studying protein conformational changes, ligand binding, enzyme mechanisms, and large biomolecular complexes underscores its value in both basic research and drug development [44] [43].
As hardware capabilities expand and algorithms refine, GaMD and its evolving variants promise to extend the computational microscope's focus to increasingly longer timescales and more complex biological systems. This progression will further solidify molecular dynamics as an indispensable tool for unraveling biochemical mechanisms and guiding therapeutic design, ultimately fulfilling the promise of the computational microscope to reveal molecular phenomena beyond the reach of experimental observation alone [3] [1].
Pushing the Limits: Overcoming the Challenges of MD Simulations
Molecular dynamics (MD) simulation functions as a computational microscope, providing an atomic-resolution view of the dynamic motions of proteins, nucleic acids, and other biomolecules that regulate biological function and dysfunction [1]. This powerful tool visualizes molecular processes by numerically solving Newton's equations of motion for all atoms in the system, typically using time steps on the order of femtoseconds (10⁻¹⁵ seconds) to maintain stability and accuracy [46] [1]. However, a fundamental dichotomy exists: while the computational method requires femtosecond resolution, the critically important biological processes it seeks to elucidate—such as protein folding, ligand binding and unbinding, and conformational changes in biomolecular complexes—routinely occur on timescales of microseconds (10⁻⁶ seconds) to milliseconds (10⁻³ seconds), and even seconds in the case of some protein-ligand dissociation events [46] [47] [48].
This disparity of nine to twelve orders of magnitude between the timestep of the simulation and the timescale of the biological event constitutes the core "Timescale Dilemma." As a result, simulating just one millisecond of real-time biological activity would require the integration of approximately one trillion simulation steps, a feat that remains computationally prohibitive for most systems with conventional MD methods [1]. This article explores the origins of this dilemma, the innovative computational methods developed to overcome it, and how these solutions enhance the utility of MD as a computational microscope for drug discovery and biomedical research.
The Fundamental Challenge: Why Timescales Matter
The timescale dilemma presents two interconnected challenges: the computational cost of long simulations and the physical accuracy of the models used.
The Sampling Problem in Protein Folding
Protein folding simulations represent one of the most demanding applications of MD. Observing a single folding event from an unfolded state to the native conformation requires a simulation long enough to capture this rare event, which for even small, fast-folding proteins occurs on the microsecond timescale [46]. For example, the Trpcage miniprotein (20 residues) folds in approximately 4 µs, while the villin headpiece subdomain (35 residues) folds on a timescale of microseconds to milliseconds [46] [49]. Simulating such processes with unbiased, atomistic MD requires extraordinary computational resources. Furthermore, to obtain statistically meaningful insights into the folding mechanism, one must simulate not just a single folding event, but an ensemble of events, compounding the computational challenge [46].
The Rare Event Dynamics in Molecular Interactions
Beyond folding, many fundamental biomolecular processes are characterized as "rare events"—transitions between long-lived states that occur infrequently but dictate functional kinetics. For instance, the dissociation of a ligand from its protein target can take from milliseconds to seconds [48]. In a straightforward two-state folding/unfolding model (F U), the rate constant measurable in experiments is the sum of the folding (kFU) and unfolding (kUF) rates. Under native conditions, the folded state is significantly more stable, meaning kFU << kUF. For villin headpiece, kUF is approximately 1/µs while kFU is approximately 1/ms [49]. A single, unbiased MD simulation would need to be on the order of milliseconds to spontaneously observe the unfolding process, with many milliseconds required to collect adequate statistics.
Table 1: Characteristic Timescales of Biological Processes vs. MD Capabilities
| Process | Characteristic Timescale | Conventional MD Accessibility | Example System |
|---|---|---|---|
| Protein Vibration | Femtoseconds (10⁻¹⁵ s) | Directly Accessible | All Proteins |
| Side Chain Rotation | Picoseconds (10⁻¹² s) | Directly Accessible | All Proteins |
| Loop Dynamics | Nanoseconds (10⁻⁹ s) | Accessible | Enzyme Active Sites |
| Protein Folding | Microseconds-Milliseconds (10⁻⁶-10⁻³ s) | Challenging (Rare Event) | Villin Headpiece, WW Domain |
| Ligand Unbinding | Milliseconds-Seconds (10⁻³-1 s) | Inaccessible via Brute Force | Protein-Drug Complexes |
Overcoming the Barrier: Advanced Sampling and Accelerated Dynamics
To bridge the timescale gap, computational scientists have developed sophisticated "enhanced sampling" methods that allow simulations to escape energy minima and traverse barriers more efficiently than in conventional MD.
Gaussian Accelerated Molecular Dynamics (GaMD)
GaMD is a robust enhanced sampling technique that works by adding a harmonic boost potential to smooth the underlying potential energy surface of the system [1]. By reducing energy barriers, GaMD can accelerate conformational transitions by thousands to millions of times, effectively extending the accessible timescales from microseconds to milliseconds or even seconds within computationally feasible simulation times [1]. A key advantage of GaMD is that it is "unbiased"—it does not require pre-definition of reaction coordinates or collective variables, allowing for the discovery of unexpected pathways. This makes it particularly valuable as a computational microscope for observing complex biological processes, such as the conformational transitions of the CRISPR-Cas9 system and the binding and dissociation of inhibitors to the SARS-CoV-2 viral proteins [1].
Transition Path Sampling and the Multistate Transition Interface Sampling (MS-TIS)
Methods like MS-TIS focus specifically on sampling the rare transitions between metastable states. Instead of running one long, inefficient simulation, these algorithms use a path-sampling approach [49]. They intelligently generate ensembles of short trajectories that connect defined states (e.g., folded and unfolded), stitching together a complete picture of the transition network and its kinetics. Du and Bolhuis demonstrated the power of MS-TIS by efficiently simulating both the folding and unfolding of the villin headpiece, revealing metastable near-native states and a compulsory intermediate [49]. This approach can be seen as a marriage between Markov state modeling and path-sampling, resulting in a kinetic network that describes the slow conformational changes in the macromolecule.
Dissipation-Corrected Targeted MD (dcTMD)
dcTMD addresses the timescale problem through a coarse-graining approach based on statistical mechanics [48]. It involves actively "pulling" a system along a coordinate of interest (e.g., a ligand moving away from a binding pocket) and analyzing the work done to decompose the process into a free energy profile and a spatially-resolved friction profile [48]. These fields can then be used to run efficient Langevin equation simulations, which can predict dynamics on the order of seconds in a matter of hours on a standard desktop computer [48]. This method not only predicts binding and unbinding kinetics but also provides physical insight, such as identifying the formation of a water hydration sphere as a major source of friction during dissociation [48].
Table 2: Enhanced Sampling Methods for Overcoming the Timescale Dilemma
| Method | Core Principle | Key Advantage | Typical Acceleration Factor |
|---|---|---|---|
| GaMD | Smoothes potential energy surface with a harmonic boost. | Unbiased; no need for pre-defined reaction coordinates. | 10³ - 10⁷ |
| MS-TIS | Samples ensembles of short trajectories connecting stable states. | Directly computes transition pathways and rates. | Varies (enables sampling of millisecond events) |
| dcTMD | Coarse-grains dynamics into free energy and friction fields. | Enables Langevin simulations on second timescales. | Up to 10⁶ (vs. other coarse-graining methods) |
| Replica Exchange MD | Runs parallel simulations at different temperatures and swaps configurations. | Improves sampling over rugged energy landscapes. | 10-100 |
Successfully applying MD as a computational microscope requires a suite of software, hardware, and analytical tools.
Table 3: Key Research Reagent Solutions for Molecular Dynamics Simulations
| Tool Category | Representative Examples | Function and Application |
|---|---|---|
| Biomolecular Force Fields | AMBER, CHARMM, OPLS-AA, Martini (CG) | Provide empirical potential energy functions that define interatomic forces, determining the accuracy of the simulation. |
| Specialized MD Software | GROMACS, NAMD, AMBER, OpenMM, Desmond | Highly optimized software packages for running MD simulations on various hardware platforms, including GPUs. |
| Enhanced Sampling Packages | PLUMED | A library that integrates with many MD codes to implement a wide variety of enhanced sampling algorithms. |
| Analysis and Visualization | VMD, PyMOL, MDAnalysis, MDTraj | Tools for visualizing trajectories, calculating properties (RMSD, RMSF, H-bonds), and generating publication-quality images. |
| High-Performance Computing | GPU Clusters, Anton Supercomputer, Folding@Home | Dedicated hardware that provides the massive computational throughput required for long-timescale simulations. |
Experimental Protocols: Methodologies for Key Experiments
Protocol 1: Setting Up a Conventional Protein Folding Simulation
- Initial System Preparation: Obtain an initial unfolded conformation of the protein. This can be generated by heating the native structure in a short simulation or by constructing an extended chain from the sequence.
- Solvation and Ion Addition: Place the protein in a simulation box (e.g., a dodecahedron or cubic box) filled with explicit water molecules (e.g., TIP3P, SPC/E model). Add ions (e.g., Na⁺, Cl⁻) to neutralize the system's charge and mimic a physiological salt concentration (e.g., 150 mM NaCl).
- Energy Minimization: Perform steepest descent or conjugate gradient minimization to remove any steric clashes introduced during the solvation process.
- System Equilibration:
- Run a short (50-100 ps) simulation in the NVT ensemble (constant Number of particles, Volume, and Temperature) to stabilize the temperature.
- Follow with a longer (100-500 ps) simulation in the NPT ensemble (constant Number of particles, Pressure, and Temperature) to stabilize the system's density.
- Production Simulation: Launch a multi-microsecond to millisecond-long production run in the NPT ensemble, saving atomic coordinates at regular intervals (e.g., every 100 ps). This step requires massive computational resources, often on specialized supercomputers or distributed computing networks like Folding@home [46] [49] [47].
- Trajectory Analysis: Analyze the saved trajectories to monitor folding events using metrics like the root-mean-square deviation (RMSD) from the native structure, radius of gyration (Rg), and formation of native contacts.
Protocol 2: Applying GaMD for Accelerated Conformational Sampling
- Conventional MD Equilibration: First, run a conventional MD simulation (as described in steps 1-4 above) to equilibrate the system.
- GaMD Boost Potential Calculation: During or after equilibration, calculate the standard deviation of the system's potential energy and dihedral energies to determine the parameters (upper and lower bounds) for the harmonic boost potential.
- GaMD Equilibration and Production: Run a GaMD simulation with the applied boost potential. The boost accelerates the crossing of energy barriers, leading to more frequent sampling of conformational transitions.
- Reweighting of Trajectories: Use statistical reweighting algorithms (e.g., the cumulant expansion to the second order) to recover the unbiased free energy landscape from the boosted simulation dynamics [1].
- Analysis of Conformational Changes: Identify key metastable states and the transition pathways between them through cluster analysis and construction of free energy landscapes along relevant collective variables.
Visualization of Workflows and Relationships
The following diagrams illustrate the logical relationships and workflows of key concepts and methods discussed in this article.
Diagram 1: The core challenge of the Timescale Dilemma and the computational strategies used to overcome it, ultimately enabling MD to function as a predictive computational microscope.
Diagram 2: A comparison of the conventional, inefficient "brute force" MD approach to sampling a rare folding event versus the enhanced sampling strategy, which uses many short, intelligent simulations to build a predictive model.
Future Perspectives: The Next Generation of the Computational Microscope
The field of molecular dynamics continues to evolve rapidly, with several emerging technologies poised to further extend the capabilities of the computational microscope.
- Machine Learning and Artificial Intelligence: ML and AI are being integrated into nearly every aspect of MD, from the development of more accurate and efficient force fields to the analysis of high-dimensional simulation data to identify relevant collective variables [50]. These techniques will be crucial for creating multiscale models that can seamlessly bridge different levels of resolution.
- Constant-pH Molecular Dynamics (CpHMD): For systems like lipid nanoparticles (LNPs) where the protonation states of ionizable lipids are critical and environment-dependent, scalable CpHMD models offer a way to simulate these changes in situ, providing a more accurate picture of LNP structure and function under varying pH conditions [50].
- Quantum Computing: While still in its early stages, quantum computing holds the potential to revolutionize aspects of drug discovery by tackling problems that are currently intractable for classical computers. Early applications include the precise placement of water molecules in protein binding pockets and the calculation of ligand-protein binding affinities with unprecedented accuracy [51].
The "timescale dilemma" has been a central challenge in molecular dynamics since its inception, defining the limits of the computational microscope. Through the development of sophisticated enhanced sampling algorithms like GaMD, MS-TIS, and dcTMD, researchers are no longer solely dependent on brute-force computing power to observe slow biological processes. These methods allow us to project the lens of MD into the millisecond world and beyond, providing unprecedented insights into the mechanistic underpinnings of protein folding, drug binding, and the behavior of complex nanomedicines. As these tools continue to be refined and integrated with emerging technologies from machine learning and quantum computing, the resolving power of this computational microscope will only increase, deepening our fundamental understanding of biology and accelerating the rational design of new therapeutics.
Molecular dynamics (MD) simulation serves as a computational microscope, enabling researchers to observe biological processes at an atomic level and in real time. This powerful tool relies on mathematical models known as force fields to calculate the forces between atoms and simulate their motions. However, a widely recognized deficiency in most classical force fields—such as AMBER, CHARMM, and OPLS—is their use of fixed atomic charge distributions and their inability to account for the critical phenomenon of electronic polarization [52]. Polarization is the distortion of a molecule's electron cloud in response to its changing electrostatic environment, such as when it moves from aqueous solution to a protein's hydrophobic binding pocket. This effect lowers the system's overall energy and is a key quantum mechanical property [52]. The standard approximation of fixed charges fails to capture this adaptive behavior, potentially limiting the accuracy of simulations in probing crucial biological phenomena like ligand binding, ion transport, and conformational changes in proteins. This whitepaper examines the nature of these limitations, quantifies their impact, and explores advanced methodological solutions designed to incorporate a more physically realistic representation of electrostatics.
The Core Problem: Fixed Charges and the Missing Polarization Effect
The Physical Basis of Polarization
In a real molecular system, the charge distribution of a molecule is not static. When a molecule interacts with another molecule or is placed in an external electric field, its electron cloud redistributes to lower the overall energy of the system, a process counterbalanced by the increased internal energy required to distort the charge distribution [52]. The extent of this redistribution defines the molecule's polarizability. This effect is particularly significant for proteins, which are composed of amino acids with charged, polar, and nonpolar side chains existing in the highly polar environment of aqueous solution [52]. Fixed-charge force fields are inherently incapable of modeling this essential physical phenomenon.
Practical Consequences for Simulation Accuracy
The lack of polarization can introduce systematic errors in MD simulations. For instance, fixed-charge models cannot account for the fact that the dipole moment of a polar molecule decreases when it moves from a high-dielectric medium (like water) to a low-dielectric one (like a protein interior or a membrane) [53]. This failure can affect the accuracy of simulating processes where the dielectric environment changes significantly. Furthermore, the inability to model electronic polarization helps explain why nonpolar organic liquids have static dielectric constants of about 2, a fact that fixed-charge models struggle to reproduce accurately [53]. These limitations are not merely theoretical; they have practical implications for predicting properties such as hydration free energies, binding affinities, and the behavior of ions in confined spaces [54] [53].
Quantitative Evidence: Benchmarking Force Field Errors
The errors introduced by force field imperfections can be quantified by comparing simulation results against experimental data or higher-level quantum mechanical calculations. The table below summarizes key benchmark findings that highlight the performance of various force fields and solvation models.
Table 1: Benchmarking Force Field and Solvation Model Performance
| Benchmark Study / Model | System / Property Tested | Key Finding / Error Metric | Identified Source of Error |
|---|---|---|---|
| 3D-RISM with PMVECC [54] | Hydration Free Energy (642 molecules, FreeSolv) | Mean Unsigned Error (MUE): 1.01 ± 0.04 kcal/mol | Systematic errors for molecules containing Cl, Br, I, and P; suggests needed adjustments to GAFF Lennard-Jones parameters. |
| Explicit Solvent (FreeSolv Benchmark) [54] | Hydration Free Energy | Performance used as a reference for 3D-RISM corrections. | Underlying force field deficiencies affect all solvation models. |
| FEP+ (OPLS2.1) [55] | Relative Binding Free Energy (8 test cases, 199 ligands) | MUE in Binding Affinity: 0.77 kcal/mol | Represents state-of-the-art performance with a sophisticated, polarizable force field. |
| AMBER TI (ff14SB) [55] | Relative Binding Free Energy (Same 8 test cases) | MUE in Binding Affinity: 1.01 kcal/mol | Highlights performance difference between force fields and methods. |
| OpenMM (Alchaware) [55] | Relative Binding Free Energy (Various parameter sets) | Best MUE: 0.82 kcal/mol (ff14SB, TIP3P, AM1-BCC) | Demonstrates that choice of water model and charge model impacts accuracy. |
These quantitative benchmarks reveal that while current methods can achieve impressive accuracy, systematic force field errors remain a significant source of uncertainty. The identification of specific element-related errors (e.g., with Cl, Br, I, P) underscores the fact that inaccuracies are not random but often traceable to specific parameter sets [54].
Methodological Approaches to Incorporate Polarization
Several advanced methodologies have been developed to move beyond the fixed-charge approximation. The following table compares the main approaches.
Table 2: Polarizable Force Field Methodologies
| Method | Core Mechanism | Key Features | Example Force Fields / Implementations |
|---|---|---|---|
| Induced Dipoles [53] | Places atom-centered polarizabilities; external field induces a dipole moment. | Can be solved self-consistently (more accurate) or via direct approximation (faster). | AMOEBA (full SCF), iAMOEBA water model (direct approximation). |
| Drude Oscillators [53] | Attaches auxiliary charged particles to atoms via harmonic springs. | Charge and mass are transferred to Drude particles; requires dual thermostats. | CHARMM Drude Polarizable Force Field. |
| Fluctuating Charges (FQ) [53] | Allows charge to flow between atoms in response to electric field based on electronegativity equalization. | No added particles or dipoles; but charge flow is typically bond-limited. | Various research implementations. |
| Polarizable Protein-Specific Charges (PPC) [52] | Derives a polarized charge set for a given protein structure from fragment QM calculations with implicit solvation. | Charge set is specific to the protein conformation and can be updated during dynamics. | Used as a correction in specific studies. |
| Effective Polarizable Bond Method [52] | Pre-assigns polarizabilities to specific bonds/groups based on their QM response to electric fields. | Computationally efficient; does not require full QM treatment during simulation. | Used as a correction in specific studies. |
| RESP-dPol & AM1-BCC-dPol [53] | Assigns typed atom-centered polarizabilities with compatible partial charges fitted to QM electrostatic potentials. | Designed for ease of use and speed; utilizes the direct polarization approximation. | Proof-of-concept model for C, H, O, N. |
Workflow for Parameterizing a Polarizable Model
Developing parameters for polarizable models, such as those using the induced dipole approach, requires a careful workflow to ensure compatibility and accuracy. The following diagram illustrates the key steps in parameterizing a small molecule for a force field like the one described in Search Result 6, which uses the RESP-dPol or AM1-BCC-dPol methods.
The Scientist's Toolkit: Essential Research Reagents
Implementing and validating advanced force fields requires a suite of software tools and theoretical methods.
Table 3: Key Tools and Resources for Force Field Development and Application
| Tool / Resource | Type / Category | Primary Function | Relevance to Polarization |
|---|---|---|---|
| Force Field Toolkit (ffTK) [56] | Software Plugin (VMD) | Guides and automates the parameterization of small molecules for CHARMM-compatible force fields. | Provides workflows for deriving parameters from QM target data, a prerequisite for developing polarizable terms. |
| 3D-RISM [54] | Implicit Solvation Theory | Calculates equilibrium solvent distributions and thermodynamics in a single calculation, avoiding lengthy MD. | Used to identify systematic force field errors; its corrections (PMVECC) can reveal elemental parameter issues. |
| Alchaware [55] | Automated Workflow | Performs Free Energy Perturbation (FEP) calculations using the open-source OpenMM package. | Enables benchmarking of different force field parameter sets (e.g., ff14SB vs ff15ipq) on binding affinity predictions. |
| ParamChem [56] | Web Server | Provides initial force field parameters for novel molecules by analogy to existing ones in the CGenFF force field. | Offers a starting point for parameterization, though derived parameters may require refinement via QM methods. |
| ByteFF [57] | Data-Driven Force Field | Uses a graph neural network (GNN) trained on a massive QM dataset to predict MM parameters for drug-like molecules. | Represents a modern, scalable approach to parameterization that can learn complex patterns from high-quality data. |
| AMBER & OpenMM [55] | Molecular Dynamics Engines | Software packages to run MD and free energy simulations. | Provide the computational framework for applying and testing both standard and polarizable force fields. |
| Gaussian [58] | Quantum Chemistry Software | Performs electronic structure calculations to generate target data for force field parameterization. | Essential for calculating reference electrostatic potentials, optimized geometries, and torsional profiles. |
Experimental Protocols: Detailed Methodologies
Protocol: Parameterizing a Fluorescent Protein Chromophore
This protocol, adapted from the parameterization of six fluorescent protein chromophores (EGFP, mCherry, etc.), outlines the steps for deriving consistent, transferable parameters for a novel molecule, a common task in force field development [58].
System Preparation and Initial Geometry:
- Obtain a reference structure from a reliable source (e.g., the Protein Data Bank).
- Determine the correct protonation state of the molecule under physiological conditions using literature data.
- For a chromophore embedded in a protein, excise the chromophore plus one residue on either side. Cap the resulting fragments with acetyl (ACE) and N-methyl amide (NME) groups to avoid unwanted terminal charges.
Quantum Mechanical Geometry Optimization:
- Employ a multi-step optimization process using a quantum chemistry package like Gaussian.
- Step 1: Optimize hydrogen positions using a semi-empirical method (e.g., PM3).
- Step 2: Optimize hydrogen and capping group heavy atoms using a density functional theory (DFT) method (e.g., B3LYP) and a medium-sized basis set (e.g., 6-31G(d)).
- Step 3: Optimize all atoms using the same DFT method and basis set.
- Step 4: Perform a final optimization with "TIGHT" convergence criteria and an ultrafine integration grid.
- Critical Consideration: The entire optimization should be performed in an implicit solvent model (e.g., SMD) with a dielectric constant (ε) chosen to mimic the protein environment (e.g., ε=4 to 20, such as 1-pentanol with ε=15.13). The choice of dielectric can significantly impact the final geometry and charges.
Charge Derivation:
- Using the optimized geometry, perform a single-point energy calculation to determine the electrostatic potential (ESP) around the molecule.
- Fit the partial atomic charges to replicate this QM-derived ESP using a method like RESP (Restrained Electrostatic Potential), ensuring compatibility with the target force field (e.g., AMBER).
Bond and Angle Parameterization:
- Compute the Hessian matrix (second derivatives of the energy with respect to nuclear coordinates) via a frequency calculation at the same QM level used for the final optimization.
- The force constants (kr, kθ) and equilibrium values (r0, θ0) for bonds and angles are determined by fitting the molecular mechanics potential energy surface to the QM Hessian data.
Torsion Parameter Scans:
- Identify all rotatable dihedral angles requiring parameterization.
- For each dihedral, perform a series of constrained QM calculations, rotating the dihedral angle in increments (e.g., every 15°) and calculating the single-point energy at each step. This generates a torsion potential energy profile.
- Fit the classical dihedral force constants (kφ) and periodicities (n) to reproduce the QM torsion profile.
Validation:
- Validate the complete parameter set by running MD simulations of the molecule in its native environment (e.g., inside the protein beta-barrel) and comparing structural properties (e.g., root-mean-square deviation, dihedral distributions) against crystal structure data or QM/MM simulations.
Protocol: Correcting Hydration Free Energies with 3D-RISM and ECC
This protocol uses the 3D-RISM implicit solvation model and an Element Count Correction (ECC) to rapidly identify systematic errors in force field parameters [54].
Molecule Preparation:
- Obtain a 3D structure of the small molecule of interest.
- Assign initial force field parameters (e.g., from GAFF).
3D-RISM Calculation:
- Set up a 3D-RISM calculation for the molecule in water. Use the Kovalenko-Hirata (KH) closure or a similar approximation.
- Run the calculation to obtain the hydration free energy (ΔG_RISM). This is computationally fast, often taking less than 15 seconds per molecule on a single CPU core.
Apply Post-Calculation Corrections:
- Calculate the partial molar volume (PMV) of the solute.
- Calculate the Element Count Correction (ECC). This involves simply counting the number of atoms (Ni) for each element in the molecule and multiplying by a pre-fit coefficient (ci) for that element.
- Apply the combined PMV and ECC correction (PMVECC):
ΔG_PMVECC = ΔG_RISM + a*v + b + Σ(c_i * N_i), whereaandbare universal fit parameters, andvis the PMV.
Analysis and Error Identification:
- Compare the corrected ΔG_PMVECC to the experimental hydration free energy (e.g., from the FreeSolv database).
- A large systematic error for molecules containing specific elements (e.g., Cl, Br, I, P) strongly suggests that the Lennard-Jones parameters for those elements in the base force field require adjustment. This provides a targeted approach to force field refinement.
The approximations of fixed atomic charges and the neglect of electronic polarization represent significant sources of error in classical molecular dynamics force fields, potentially limiting the resolving power of MD as a computational microscope. As detailed in this whitepaper, the research community has clearly diagnosed these problems and has made substantial progress in developing and benchmarking sophisticated solutions. From polarizable force fields based on induced dipoles and Drude oscillators to innovative data-driven approaches like ByteFF, the toolbox for addressing these imperfections is both rich and evolving. The ongoing development and validation of these methods, guided by rigorous benchmarking and automated workflows, are crucial for enhancing the predictive accuracy of molecular simulations. This progress will ensure that MD continues to serve as an indispensable tool for researchers and drug development professionals, providing ever-sharper insights into the atomic-scale mechanisms that underpin biology and medicine.
Molecular dynamics (MD) simulation functions as a powerful computational microscope, allowing researchers to observe the atomic-level motions of proteins and other biomolecules with unprecedented detail. By numerically solving Newton's equations of motion for all atoms in a system, MD provides a trajectory that describes how the positions and velocities of atoms change over time. This capability has revolutionized our understanding of molecular interactions, protein folding, and drug binding mechanisms. However, the effective use of this computational microscope is hampered by a fundamental challenge known as the sampling problem—the difficulty in adequately exploring the vast conformational space accessible to biomolecules within feasible simulation timescales. This whitepaper examines the core principles of this sampling problem and synthesizes contemporary strategies being developed to overcome it, enabling more complete characterization of protein energy landscapes and functional dynamics.
The sampling problem arises from the rugged nature of biomolecular energy landscapes, which feature numerous metastable states separated by energy barriers. Protein behavior is governed by a landscape featuring numerous valleys separated by barriers, with the valleys corresponding to functionally important metastable conformations. The inherent flexibility of proteins, especially in intrinsically disordered regions, creates a conformational ensemble of interconverting structures rather than a single, static conformation. Transitions between these conformations are critical for protein function, including enzymatic reactions, allostery, and molecular recognition. The core challenge is that biologically relevant conformational changes often occur on timescales of milliseconds to seconds, whereas even state-of-the-art MD simulations typically reach only microseconds without enhanced sampling techniques. This timescale disparity means that conventional MD simulations often remain trapped in local energy minima, unable to observe functionally important but rarely sampled states.
The Fundamental Sampling Challenge in Biomolecular Simulation
Timescale Disparity and Energy Barriers
The sampling problem represents a fundamental challenge in molecular dynamics simulations, primarily due to the timescale disparity between computationally accessible simulation time and biologically relevant phenomena. An MD simulation with an atomistic force field requires integration time steps on the order of femtoseconds (10⁻¹⁵ s) to maintain numerical stability, whereas biologically interesting events such as protein folding can take milliseconds (10⁻³ s) or longer. This requires >10¹² integration time steps, which remains computationally prohibitive for most systems. At each step, interactions between tens or hundreds of thousands of atoms must be evaluated, making microsecond to millisecond simulations achievable only with specialized hardware or massive parallelization.
The sampling challenge is exacerbated by the high-dimensional nature of biomolecular conformational space. A protein of modest size has thousands of degrees of freedom, creating an astronomical number of possible configurations. The energy landscape describing this space is typically rugged, comprising numerous metastable states separated by energy barriers. Crossing these barriers requires rare, thermally activated events that occur infrequently compared to the simulation timescale. This landscape ruggedness means MD simulations can remain trapped in local minima, unable to adequately sample the full conformational ensemble. This trapping prevents accurate determination of relative state populations and transition kinetics, limiting the predictive power of simulations.
The Critical Role of Collective Variables
A fundamental concept in addressing the sampling problem is the use of collective variables (CVs), which are low-dimensional representations of a system's complex high-dimensional configuration. CVs are functions of atomic coordinates that distinguish between different metastable states and describe the progress of transitions between them. Common choices include geometric parameters (e.g., radius of gyration), principal components, evolutionary correlations, and root-mean-square deviation from reference structures. The efficacy of enhanced sampling methods hinges critically on finding suitable CVs; without them, these methods provide little more acceleration than standard MD simulations.
Recent theoretical advances have emphasized that true reaction coordinates (tRCs)—the few essential protein coordinates that fully determine the committor probability of reaching a new state—represent the optimal CVs for accelerating conformational changes. True reaction coordinates control both conformational changes and energy relaxation, enabling highly efficient barrier crossing when biased. Biasing true reaction coordinates has been shown to accelerate conformational changes and ligand dissociation in model systems by 10⁵ to 10¹⁵-fold, while generating trajectories that follow natural transition pathways. In contrast, biased trajectories from empirical collective variables often display non-physical features, highlighting the critical importance of CV selection.
Traditional Enhanced Sampling Methodologies
Biased Sampling Techniques
Traditional enhanced sampling methods often employ bias potentials to accelerate barrier crossing and improve conformational exploration. These techniques include:
- Umbrella Sampling: This method uses harmonic restraints along a predetermined reaction coordinate to enforce sampling of specific regions of configuration space. The biased simulations are then reweighted to reconstruct the underlying free energy landscape.
- Metadynamics: This approach adds a history-dependent bias potential, typically composed of Gaussian functions, to discourage the system from revisiting previously sampled configurations. This forces exploration of new regions of conformational space.
- Adaptive Biasing Force: This technique applies a continuous force along a collective variable that exactly compensates for the system's mean force, resulting in uniform sampling along the chosen CV.
These methods have proven successful for many applications but share a critical limitation: their effectiveness depends entirely on the choice of collective variables. Poor CV selection leads to the "hidden barrier" problem, where slow dynamics orthogonal to the chosen CVs prevent efficient sampling.
Parallel Sampling Methods
Alternative approaches leverage massive parallelization to enhance conformational sampling:
- Replica Exchange Molecular Dynamics (REMD): Also known as parallel tempering, this method runs multiple simulations concurrently at different temperatures, with periodic attempts to exchange configurations between temperatures. This allows high-temperature replicas to cross barriers more easily and disseminate this information to low-temperature replicas.
- Markov State Models (MSMs): This framework uses many short, parallel MD simulations to statistically model the kinetics and thermodynamics of biomolecular dynamics. MSMs have been used to study slow dynamical processes, including protein folding and conformational transitions, that would otherwise require prohibitively long simulations.
Table 1: Comparison of Traditional Enhanced Sampling Methods
| Method | Core Principle | Key Advantages | Limitations |
|---|---|---|---|
| Umbrella Sampling | Harmonic biasing along predefined CVs | Direct free energy calculation; Intuitive setup | Requires prior knowledge of reaction coordinate; Hidden barriers |
| Metadynamics | History-dependent bias deposition | Progressive exploration of landscape; Less dependent on initial path | Bias convergence difficult to assess; Choice of deposition rate critical |
| Adaptive Biasing Force | Instantaneous force compensation along CV | Provides direct estimate of mean force; Efficient for low-dimensional CVs | High computational cost for complex CVs; Sensitive to CV quality |
| Replica Exchange MD | Parallel simulations at different temperatures | No need for predefined CVs; Thermodynamically rigorous | Number of replicas grows with system size; Limited barrier crossing at low T |
| Markov State Modeling | Many short parallel simulations combined | Extracts kinetics and mechanism; Scalable to very large systems | Model construction requires care; Limited by shortest simulation time |
AI and Machine Learning Approaches
Learning Collective Variables from Data
Machine learning methods have emerged as powerful tools for identifying meaningful collective variables directly from simulation data, addressing a key bottleneck in enhanced sampling. These approaches include:
- Dimensionality Reduction Techniques: Methods such as time-lagged independent component analysis (tICA) and variational autoencoders can identify slow modes and intrinsic coordinates from unbiased or enhanced simulation data. The generalized work functional method generates an orthonormal coordinate system that disentangles true reaction coordinates from non-essential coordinates by maximizing potential energy flows through individual coordinates.
- Deep Learning Architectures: Neural networks can learn non-linear collective variables that capture the essential dynamics of complex biomolecular transitions. For example, the Internal Coordinate Net uses an autoencoder architecture with a 3D latent space to learn physical principles of conformational changes from MD simulation data, enabling efficient generation of novel synthetic conformations.
These data-driven approaches can overcome the limitations of human intuition in selecting collective variables, which often fails for complex biomolecular transitions. By automatically identifying the key coordinates governing conformational changes, machine learning methods enable more efficient sampling of relevant regions of configuration space.
Generative Models for Conformational Ensemble Prediction
Generative artificial intelligence offers an alternative paradigm for conformational sampling that can bypass kinetic barriers entirely:
- Internal Coordinate Net: This unsupervised deep learning model learns physical principles of conformational changes from MD simulation data using a novel bond-angle-torsion (BAT) based vector representation. The model compresses protein conformations into a 3D latent space, where interpolating between data points rapidly identifies novel synthetic conformations with sophisticated sidechain and backbone arrangements.
- Diffusion Models: Recently, generative models leveraging diffusion and flow matching techniques have emerged as powerful tools for predicting protein multiple conformations. These models transform protein structure prediction into a sequence-to-structure generation task through iterative denoising, effectively sampling equilibrium distributions of molecular systems.
These AI methods can generate diverse conformational ensembles orders of magnitude faster than conventional MD simulations, making them particularly valuable for initial exploration of conformational landscapes or for systems with extremely slow dynamics. When applied to the highly dynamic amyloid-β₁–₄₂ monomer, deep learning models provided comprehensive sampling of conformational landscapes, revealing clusters that rationalize experimental findings and identifying novel conformations with important interactions not present in the training data.
Table 2: AI-Based Approaches for Conformational Sampling
| Method | Architecture | Key Features | Demonstrated Applications |
|---|---|---|---|
| Internal Coordinate Net | Autoencoder with 3D latent space | vBAT coordinate system avoids periodicity; Accurate reconstruction (RMSD <1.3Å) | Aβ42 monomer conformational landscape; αB-crystallin dynamics |
| Energy Flow Theory | Physics-based coordinate identification | Identifies true reaction coordinates; Potential energy flow analysis | HIV-1 protease flap opening; PDZ domain allostery |
| Generative Diffusion Models | Denoising diffusion probabilistic models | Iterative refinement from noise; Equilibrium distribution sampling | Multi-state protein conformations; Ligand-bound states |
| AlphaFold-based Sampling | Modified AlphaFold2 architecture | MSA masking and subsampling; Co-evolutionary information exploitation | CASP15 multi-conformation targets |
Specialized Approaches for Challenging Systems
Intrinsically Disordered Proteins
Intrinsically disordered proteins (IDPs) represent an extreme case of the sampling problem, as they explore vast conformational spaces without folding into stable tertiary structures. Traditional MD simulations face exceptional challenges with IDPs due to:
- Lack of Structural Constraints: The absence of stable hydrophobic cores allows IDPs to sample an exceptionally wide range of conformations.
- Computational Expense: Capturing IDP diversity requires simulations spanning microseconds to milliseconds, demanding immense computational resources.
- Rare Conformations: MD may fail to sample biologically relevant but transient states crucial for IDP function.
Specialized methods have been developed for IDP conformational sampling:
- Replica Exchange with Solute Tempering: This variant of replica exchange preferentially heats the solute degrees of freedom, improving sampling efficiency for disordered proteins.
- Probabilistic MD Chain Growth: This novel protocol combines flexible-meccano and hierarchical chain growth methods with statistical data from tripeptide MD trajectories as starting points, enabling rapid generation of conformational ensembles for disordered regions.
- Gaussian Accelerated MD: This enhanced sampling method has been used to capture proline isomerization events in disordered regions, revealing conformational switches that may regulate biological function.
Integrating Experimental Data
Hybrid approaches that integrate experimental data with molecular simulations can guide and validate conformational sampling:
- Variability Refinement of Cryo-EM Data: The Phenix.varref tool refines an ensemble of structures into multiple maps from cryo-EM variability analysis, facilitating interpretation of continuous heterogeneity resulting from local protein motion before flash-freezing. This approach enables visualization of protein movements observed in cryo-EM experiments.
- Experimental Restraints: Methods that incorporate experimental data—such as NMR chemical shifts, J-couplings, residual dipolar couplings, and SAXS profiles—as restraints in simulations can guide sampling toward experimentally relevant regions of conformational space.
These integrative approaches help address the validation challenge in enhanced sampling by ensuring that computational ensembles agree with experimental observables.
Advanced Sampling at Quantum Mechanical Accuracy
Bridging the Accuracy-Sampling Trade-off
A fundamental challenge in biomolecular simulation is the trade-off between computational efficiency and physical accuracy. Classical force fields, while efficient, make approximations that limit their accuracy for certain chemical processes. Recent advances aim to overcome this limitation:
- Ab Initio Molecular Dynamics: Simulations at the density functional theory (DFT) level provide quantum mechanical accuracy but have been traditionally restricted to small systems and short timescales due to prohibitive computational costs.
- Machine Learning Potentials: Neural network potentials trained on quantum mechanical data can approach ab initio accuracy while retaining the efficiency of classical force fields. For example, the AIMD-Chig dataset provides 2 million conformations of the 166-atom protein Chignolin sampled at the DFT level, serving as a benchmark for developing machine learning potentials for proteins.
These approaches enable exploration of protein conformational space with quantum mechanical accuracy, essential for processes involving electronic polarization, charge transfer, or chemical reactions.
The Scientist's Toolkit: Research Reagent Solutions
Table 3: Essential Computational Tools for Conformational Sampling
| Tool/Resource | Type | Function | Key Applications |
|---|---|---|---|
| GROMACS | MD Software Package | High-performance molecular dynamics simulations | General biomolecular dynamics; Enhanced sampling methods |
| AMBER | MD Software Package | Molecular dynamics with specialized force fields | Protein folding; Drug binding; Nucleic acid dynamics |
| OpenMM | MD Software Package | Hardware-accelerated molecular dynamics | Custom simulation workflows; GPU-accelerated sampling |
| Phenix.varref | Cryo-EM Analysis Tool | Ensemble refinement into cryo-EM variability maps | Interpreting continuous heterogeneity in cryo-EM data |
| CLAYFF | Force Field | Molecular dynamics for layered materials | Layered double hydroxide materials; Ion exchange processes |
| ATLAS Database | MD Database | Simulations of ~2000 representative proteins | Protein dynamics analysis; Method validation |
| GPCRmd | Specialized Database | MD simulations of GPCR proteins | GPCR functionality and drug discovery |
| AIMD-Chig | Quantum Dataset | DFT-level conformations of Chignolin | Benchmarking machine learning potentials; Ab initio accuracy |
Integrated Workflow for Comprehensive Conformational Sampling
Diagram 1: Integrated Workflow for Conformational Sampling. This workflow combines initial broad exploration with targeted refinement and experimental validation to achieve comprehensive conformational sampling.
The sampling problem remains a central challenge in molecular dynamics simulations, but recent methodological advances have dramatically improved our ability to explore biomolecular conformational landscapes. The integration of traditional enhanced sampling methods with machine learning approaches and experimental data has created a powerful toolkit for overcoming the timescale limitations of conventional MD. As these methods continue to mature, particularly with the incorporation of quantum mechanical accuracy through machine learning potentials, molecular dynamics is poised to fulfill its potential as a truly predictive computational microscope. This will enable researchers to tackle increasingly complex biological questions, from the mechanisms of allosteric regulation to the design of conformation-specific therapeutics, fundamentally advancing our understanding of biomolecular function.
Molecular dynamics (MD) has firmly established itself as a "computational microscope," providing atomic-level resolution into the dynamic processes of biomolecular systems. This whitepaper examines the central computational challenges that have historically constrained MD simulations and explores the transformative technologies overcoming these barriers. We detail how the integration of GPU hardware acceleration and machine learning potentials is revolutionizing the field, enabling researchers to access previously unattainable spatiotemporal scales with quantum-level accuracy. Within drug discovery and pharmaceutical development, these advancements are providing unprecedented insights into conformational ensembles, protein-ligand interactions, and complex cellular environments, thereby accelerating the rational design of therapeutics.
The fundamental objective of molecular dynamics is to simulate the physical motions of atoms and molecules over time, based on the numerical solution of Newton's laws of motion. By capturing the dynamical behavior of biological systems, MD serves as a powerful computational microscope, revealing processes that are difficult or impossible to observe experimentally [59] [60]. The first MD simulation of a biomolecule in 1977 tracked a mere 58 residues of bovine pancreatic trypsin inhibitor for 9.2 picoseconds [59]. For decades, the field was hampered by immense computational hurdles that limited the system sizes and simulation timescales that could be practically studied.
Modern therapeutic development increasingly relies on MD simulations to reduce the time and cost of research and development for new drugs [61] [60]. These simulations provide critical insights during target validation, lead discovery, and lead optimization phases. However, the full potential of MD as a computational microscope has only been realized recently through two synergistic technological developments: the widespread adoption of GPU computing for massive parallelization, and the integration of machine learning to create accurate, efficient force fields and enhanced sampling methods [62] [20].
Computational Hurdles in Traditional Molecular Dynamics
The Timescale and Sampling Problem
A fundamental challenge in conventional MD is the timescale problem. Biologically relevant events—such as protein folding, conformational changes in drug targets, and allosteric transitions—often occur on microsecond to millisecond timescales or longer [59]. However, the femtosecond time step required for numerical stability in atomistic simulations creates a massive computational barrier to reaching these biologically meaningful durations.
Closely related is the sampling problem. Molecular systems navigate complex, high-dimensional energy landscapes where functionally important states may be separated by substantial energy barriers. Conventional MD simulations can become trapped in local energy minima, failing to adequately explore the full conformational landscape relevant to biological function and drug binding [59] [62]. As proteins are highly dynamic in solution, and ligand binding pockets often sample many pharmacologically relevant conformations, inadequate sampling can severely limit the predictive power of MD simulations in drug discovery [59].
Force Field Accuracy and Transferability
Classical MD simulations employ parameterized analytical approximations—force fields—that represent atoms and bonds as simple spheres connected by virtual springs [59]. While these force fields have been meticulously parameterized, they impose fundamental physical approximations that overlook crucial interactions such as electron correlation, nuclear quantum effects, and electron delocalization [59]. Consequently, classical simulations cannot model chemical reactions and may miss subtle non-covalent effects that impact ligand binding.
The accuracy-transferability trade-off presents another significant challenge. Force fields parameterized for specific molecular classes may not transfer reliably to novel systems, particularly in heterogeneous aqueous and interfacial environments relevant to drug action [62]. More accurate quantum mechanical methods like Kohn-Sham density functional theory can capture these effects but remain computationally prohibitive for most biomolecular systems [59].
Hardware and Throughput Limitations
The computational demand of MD simulations has historically exceeded available computing resources. As noted in search results, "Many applications—weather forecasting, computational fluid dynamics simulations, and more recently machine learning and deep learning—need an order of magnitude more computational power than is currently available" [63].
The throughput limitations of central processing unit (CPU)-based computing created a persistent bottleneck. CPU architectures are designed to minimize latency within each thread, dedicating significant transistor resources to control logic and large caches [63]. This design is ill-suited to the massively parallel nature of MD force calculations, where the same mathematical operations must be applied to all atoms in the system simultaneously. Before the GPGPU (General Purpose GPU) era, these architectural mismatches severely constrained MD applicability to biologically relevant problems.
GPU Computing: A Hardware Revolution for MD
The GPU Architecture Advantage
Graphics Processing Units (GPUs) have revolutionized MD simulations by providing a fundamentally different processor architecture optimized for parallel throughput rather than single-thread performance [63]. As visualized in Figure 1, GPUs dedicate most of their transistors to data processing units rather than control logic and caching, making them ideally suited for the simultaneous force calculations required in MD.
Diagram: CPU vs GPU Architecture for MD
This architectural difference enables GPUs to hide instruction and memory latency through computation, switching between thousands of lightweight threads as they await data [63]. For MD simulations, this means that when calculations for one group of atoms are stalled waiting for memory access, the GPU can immediately switch to processing other atoms, maintaining high computational throughput.
Performance Benchmarks in Modern MD Simulations
Recent benchmarks of the AMBER 24 molecular dynamics suite demonstrate the dramatic performance advantages of modern GPU architectures across biological systems of varying sizes [64]. The performance data in Table 1 illustrates how different GPU architectures perform across simulation systems ranging from small implicit solvent models to massive explicit solvent simulations exceeding one million atoms.
Table 1: AMBER 24 Performance Benchmarks (ns/day) Across GPU Architectures [64]
| GPU Model | Architecture | STMV (1M atoms) | Cellulose (408K atoms) | Factor IX (90K atoms) | DHFR (23K atoms) | Myoglobin GB (2.4K atoms) |
|---|---|---|---|---|---|---|
| RTX 5090 | Blackwell | 109.75 | 169.45 | 529.22 | 1655.19 | 1151.95 |
| RTX 6000 Ada | Ada Lovelace | 70.97 | 123.98 | 489.93 | 1697.34 | 1016.00 |
| GH200 Superchip | Hopper | 101.31 | 167.20 | 191.85 | 1323.31 | 1159.35 |
| B200 SXM | Blackwell | 114.16 | 182.32 | 473.74 | 1513.28 | 1020.24 |
| H100 PCIe | Hopper | 74.50 | 125.82 | 410.77 | 1532.08 | 1094.57 |
| RTX A6000 | Ampere | 39.08 | 63.15 | 273.64 | 1132.86 | 648.58 |
The benchmarking data reveals several key insights for researchers selecting hardware for MD simulations. First, larger systems benefit disproportionately from newer architectures—the NVIDIA Blackwell GPUs show particularly strong performance with million-atom systems. Second, the performance hierarchy varies by system size; while the RTX 5090 leads in most large-system benchmarks, the RTX 6000 Ada performs exceptionally well with medium-sized systems like DHFR [64]. Third, data center GPUs like the B200 and GH200 offer impressive performance but at a cost that may not be justified for molecular dynamics alone, as they are primarily geared toward AI workloads [64].
Practical Hardware Selection Guidelines
Based on current benchmark data and architectural considerations, we recommend:
For large systems (>100,000 atoms): NVIDIA's latest Blackwell architecture GPUs (RTX 5090, RTX PRO 6000) provide the best performance, with the RTX 5090 offering particularly good cost-effectiveness for single-GPU workstations [64].
For medium systems (50,000-100,000 atoms): Both Ada Lovelace and Blackwell architectures perform well, with the RTX 5000 Ada representing a strong price-to-performance option [64].
For small systems (<50,000 atoms): The NVIDIA RTX PRO 4500 Blackwell provides excellent performance at a lower price point, making it ideal for high-throughput simulations of smaller molecules [64].
For multi-GPU deployments: Because AMBER doesn't leverage multi-GPU acceleration for single calculations but instead runs multiple independent simulations in parallel, systems with multiple mid-range GPUs often provide better throughput than single high-end GPUs [64].
Machine Learning Potentials: Overcoming Accuracy Limitations
Machine Learning Force Fields (MLFFs)
Machine learning force fields represent a paradigm shift from traditional parameterized force fields. Instead of using fixed analytical forms with tuned parameters, MLFFs learn the potential energy surface directly from quantum mechanical reference calculations [59] [62]. Given enough conformationally diverse and sufficiently accurate training data, these models can effectively learn arbitrary potential energy surfaces without imposing analytical constraints [59].
General-purpose machine learning force fields trained on millions of small-molecule DFT calculations, such as ANI-2x, can now be applied to biomolecular simulations [59]. These MLFFs maintain quantum chemistry accuracy while enabling nanosecond-scale simulations with thousands of atoms—a capability previously impossible with conventional quantum mechanical methods [62].
Table 2: Comparison of Force Field Approaches in MD Simulations
| Force Field Type | Accuracy | Computational Cost | Transferability | Reaction Capability |
|---|---|---|---|---|
| Classical (e.g., GROMOS, CHARMM) | Low-Medium | Low | Medium | No |
| Quantum Mechanical (DFT) | High | Very High | High | Yes |
| Machine Learning (e.g., ANI-2x) | High | Medium | Medium-High | Yes |
ML-Enhanced Sampling Methods
Machine learning has also revolutionized conformational sampling in MD simulations. Enhanced sampling techniques such as umbrella sampling, metadynamics, and weighted ensemble path sampling aim to improve sampling along predefined progress coordinates (collective variables) [59]. However, selecting appropriate coordinates traditionally required substantial prior knowledge of the system.
Modern ML approaches automatically discover relevant collective variables from simulation data. Techniques such as autoencoders and other neural network architectures map molecular systems onto low-dimensional spaces where progress coordinates can better capture complex rare events [59]. These methods have proven particularly valuable in studying processes like protein folding, ligand unbinding, and phase transitions in aqueous systems [62].
Integration with Structure Prediction
Machine learning structure prediction tools like AlphaFold have created new opportunities for accelerating MD simulations. While AlphaFold can predict protein structures with remarkable accuracy, it often struggles with precise sidechain positioning sufficient for CADD applications [59]. Brief MD simulations can correct these misplaced sidechains, significantly improving the accuracy of subsequent ligand-binding predictions [59].
Modified AlphaFold pipelines can also overcome the default implementation's tendency to converge on a single conformation, enabling prediction of entire conformational ensembles [59]. These diverse conformations can then serve as seeds for short simulations, bypassing the need for long-timescale simulations that would otherwise be required to transition between conformational states [59].
Integrated Workflows: GPU Computing Meets ML Potentials
Synergistic Workflow for Drug Discovery
The combination of GPU acceleration and machine learning potentials creates powerful workflows for drug discovery. Figure 2 illustrates how these technologies integrate into a comprehensive pipeline for structure-based drug design, from target identification to lead optimization.
Diagram: Integrated MD-ML Workflow for Drug Discovery
This workflow demonstrates how GPU-accelerated MD simulations and ML potentials operate synergistically. The GPU handling the computationally intensive sampling and dynamics, while ML methods enhance every stage—from initial structure prediction and pocket detection to analysis of simulation trajectories and binding affinity prediction.
Experimental Protocol: Implementing ML-Guided GPU MD
For researchers implementing these methodologies, we provide a detailed protocol for running ML-guided MD simulations on GPU hardware:
System Preparation:
- Obtain protein structure from PDB or predict using AlphaFold2 with multiple sequence alignment masking to generate conformational diversity [59].
- Parameterize small molecules using GAFF2 or similar force fields, generating topology files with tools like ACPYPE [65].
- Solvate the system in TIP3P water within a cubic box, maintaining a minimum 1.0 nm distance between protein and box edges [65].
- Add ions to neutralize system charge using Monte Carlo ion placement.
GPU-Accelerated Simulation:
- Perform energy minimization using steepest descent algorithm (maximum 50,000 steps) until maximum force < 1000 kJ/mol/nm [65].
- Equilibrate in NVT ensemble for 100 ps at 310 K using V-rescale thermostat (τ = 0.1 ps), applying position restraints to protein and ligand heavy atoms [65].
- Equilibrate in NPT ensemble for 100 ps at 310 K and 1 bar using Parrinello-Rahman barostat (τ = 2.0 ps) [65].
- Run production simulation for 50-100 ns using a 2 fs time step with LINCS constraints on all bonds involving hydrogen atoms [65].
- Utilize Particle Mesh Ewald for electrostatic interactions with Verlet cutoff scheme for neighbor searching [65].
ML-Enhanced Analysis:
- Extract conformational ensembles from trajectories using clustering algorithms.
- Apply autoencoder-based dimensionality reduction to identify relevant collective variables [59].
- Use ML potentials (e.g., ANI-2x) for selected frames to refine energy estimates [59] [62].
- Predict binding affinities using delta machine learning scoring functions trained on quantum mechanical calculations [61].
Research Reagent Solutions: Essential Tools for Modern MD
Table 3: Essential Software and Hardware Tools for ML-Enhanced GPU MD
| Tool Name | Type | Function | Application in MD Workflow |
|---|---|---|---|
| NVIDIA RTX 5090 | Hardware | GPU Acceleration | Massively parallel force calculations for large systems [64] |
| GROMACS | Software | MD Engine | Optimized for GPU acceleration with ML force field support [65] |
| ANI-2x | Software | Machine Learning Force Field | Quantum accuracy at classical cost for reaction modeling [59] |
| AlphaSpace2 | Software | Pocket Detection | Fragment-centric topographical mapping of binding sites [61] |
| AutoDock Vina | Software | Molecular Docking | Template-independent blind docking for pose generation [65] |
| DeepSurf | Software | Binding Site Prediction | 3D-CNN for identifying druggable sites on protein surfaces [61] |
Applications in Drug Discovery and Pharmaceutical Development
Solubility Prediction with ML-Analyzed MD
The integration of MD with machine learning has enabled accurate prediction of critical pharmaceutical properties like aqueous solubility. Recent research has demonstrated that MD-derived properties combined with ML algorithms can predict drug solubility with remarkable accuracy (R² = 0.87) [20]. Key MD-derived properties identified as significant predictors include:
- Solvent Accessible Surface Area (SASA)
- Coulombic and Lennard-Jones interaction energies
- Estimated Solvation Free Energies (DGSolv)
- Root Mean Square Deviation (RMSD)
- Average number of solvents in Solvation Shell (AvgShell) [20]
When these properties were used as features in Gradient Boosting algorithms, they demonstrated predictive performance comparable to models based on traditional structural descriptors [20]. This approach provides not just predictions but also physical insights into the molecular determinants of solubility.
Protein-Ligand Binding and Allostery
GPU-accelerated MD combined with ML analysis has transformed the study of protein-ligand interactions. Long-timescale simulations can now capture conformational changes relevant to drug binding that were previously inaccessible [59]. ML approaches help analyze these trajectories to identify cryptic pockets, allosteric sites, and binding mechanisms [61].
Tools like AlphaSpace employ fragment-centric topographical mapping to identify targetable regions in protein-protein interactions [61]. This approach has successfully guided the optimization of minimal protein mimetics that target PPIs by expanding mimetics to target secondary binding sites, resulting in significant improvements in binding affinity [61].
Environmental Toxicology and Cancer Research
The combined power of GPU-MD and ML has advanced environmental toxicology, particularly in understanding mechanisms of carcinogenicity for pollutants like dioxins [65]. Integrated computational approaches using network toxicology, machine learning modeling, molecular docking, and MD simulations have identified key proteins and pathways through which dioxins promote liposarcoma development [65].
These integrated approaches enabled researchers to build predictive models using 117 combinations of machine learning algorithms, subsequently validated through MD simulations [65]. The workflows identified specific receptor interactions and suggested potential therapeutic interventions, demonstrating how MD serves as a computational microscope for environmental carcinogenesis.
Future Perspectives and Challenges
Despite remarkable progress, significant challenges remain in the integration of GPU computing and machine learning potentials. Current ML force fields, while accurate, remain slower than classical methods and require extensive training data [59]. We expect ongoing advancements in computational speed and accuracy to broaden their adoption in the future.
Emerging hardware technologies promise further acceleration. Application-specific integrated circuits (ASICs) like the Anton series demonstrate the tremendous performance gains possible through specialized hardware, with Anton 3 achieving a 460-fold speedup compared to general-purpose supercomputers [59]. Future systems incorporating ASICs, FPGAs, or other specialized hardware could enable routine access to biologically relevant timescales.
The integration of MD with experimental data represents another frontier. As cryo-EM and other structural biology techniques produce increasingly dynamic and heterogeneous structural data, MD simulations will be essential for interpreting these ensembles and connecting structures to function. The computational microscope of MD, empowered by GPU acceleration and ML potentials, will continue to reveal the dynamic mechanisms of biological systems and transform drug discovery.
Is What We See Real? Validating and Benchmarking MD Results
Molecular dynamics (MD) simulation has emerged as a powerful computational microscope, enabling researchers to observe biomolecular processes at atomic resolution and on timescales inaccessible to most experimental techniques. As a computational method, MD provides the unique capability to simulate the dynamic behavior of biological macromolecules in silico, predicting not only their most stable conformations but also the transient states and pathways that are crucial for understanding function. However, the predictive power and biological relevance of any MD study must be rigorously validated against experimental structural data. This validation establishes MD not merely as a computational tool but as a genuine microscope into the molecular world—one that can extrapolate beyond experimental limitations to provide a complete dynamic picture. Nuclear Magnetic Resonance (NMR) spectroscopy and X-ray crystallography serve as the gold standard experimental methods for this validation, each providing complementary insights into protein structure and dynamics. This whitepaper provides an in-depth technical guide for researchers and drug development professionals on the methodologies for systematically comparing MD results with these experimental techniques, framing the discussion within the broader thesis of MD as an essential component of modern structural biology.
Quantitative Comparison of NMR and Crystallographic Data
To effectively validate MD simulations, one must first understand the inherent similarities and differences between the primary experimental structures used for comparison. Large-scale systematic analyses of protein structures determined by both NMR and X-ray crystallography reveal important quantitative relationships.
Table 1: Systematic Comparison of NMR and Crystal Structures
| Comparison Metric | NMR vs. Crystal Structures (Soluble Proteins) | NMR vs. Crystal Structures (Membrane Proteins) | Key Observations |
|---|---|---|---|
| Global Backbone RMSD | 1.0 - 2.5 Å [66] | Up to 5.0 Å in membrane regions [67] | Membrane proteins show greater variability due to environmental challenges |
| Secondary Structure Element Agreement | β-strands match better than helices or loops [66] | Higher convergence in membrane regions [67] | Crystal structures typically have straighter transmembrane regions [67] |
| Side Chain Conformations | Hydrophobic residues more similar than hydrophilic [66] | Buried sidechains rarely adopt different orientations [66] | Crystal structures show higher stereochemical correctness and tighter packing [67] |
| Solvent Accessibility Correlation | Modest correlation (coefficient = 0.462) [66] | Not explicitly quantified | Conformational differences in loops are independent of crystal packing [66] |
The data reveal that while systematic differences exist between structures determined by different methods, the core structural elements remain largely consistent. For soluble proteins, the backbone RMSD between NMR and crystal structures typically ranges between 1.0 and 2.5 Å [66], while membrane proteins exhibit larger deviations, particularly in their transmembrane regions (up to 5.0 Å) [67]. These differences can be attributed to both methodological factors and the distinct physical environments (solid state versus solution) in which the structures are determined.
Experimental Protocols for Structure Validation
NMR Relaxation Measurements and Analysis
NMR provides unique insights into protein dynamics across multiple timescales, making it particularly valuable for validating MD trajectories. The following protocol outlines key steps for backbone dynamics characterization:
- Sample Preparation: Proteins are uniformly labeled with (^{15}\mathrm{N}) and/or (^{13}\mathrm{C}) through recombinant expression in isotopically enriched media. For larger proteins (>25 kDa), selective labeling or deuteriation may be necessary [68].
- Data Collection: Heteronuclear relaxation parameters including (T1), (T2), and (^{1}\mathrm{H})-(^{15}\mathrm{N}) NOE are measured at multiple magnetic field strengths using established pulse sequences [68].
- Spectral Processing and Analysis: NMR spectra are processed and analyzed to obtain peak intensities, which are fitted to exponential decays to extract relaxation rates.
- Model-Free Analysis: Relaxation parameters are interpreted using the model-free formalism of Lipari and Szabo to extract quantitative dynamics parameters: the generalized order parameter ((S^2)), which characterizes the amplitude of ps-ns timescale motions, and effective correlation times for internal motions [68].
- Spectral Density Mapping: As an alternative model-free approach, relaxation data can be used to map the spectral density function, providing a model-independent characterization of dynamics [68].
Crystallographic Structure Refinement and Analysis
X-ray crystallography provides high-resolution structural snapshots that serve as critical benchmarks for MD simulations:
- Crystal Structure Determination: High-resolution structures (typically <2.0 Å) are determined using molecular replacement or experimental phasing methods [67] [69].
- Quality Assessment: Structures are validated using geometric parameters (Ramachandran plots, rotamer libraries) and agreement with electron density maps (Real Space R-factor, RSCC) [67].
- Thermal Parameter Analysis: B-factors (atomic displacement parameters) are extracted to quantify atomic mobility and disorder within the crystal lattice.
- Packing Interface Analysis: Crystal packing contacts are identified and distinguished from biologically relevant interfaces using specialized software [66].
- Comparative Analysis: Multiple crystal structures of the same protein (e.g., in different conformational states or with different ligands) are compared to identify conserved structural features and flexible regions.
Integrated Workflows for MD Validation
The true power of MD as a computational microscope emerges when it is integrated with experimental structural biology techniques in a complementary workflow.
Diagram 1: Integrated validation workflow. This diagram illustrates the synergistic relationship between MD simulation and experimental techniques in generating and validating structural models.
Protocol for Direct MD-to-Experiment Comparison
- RMSD and RMSF Calculations: Calculate root-mean-square deviation (RMSD) of MD trajectories against experimental structures to assess overall conformational sampling, and root-mean-square fluctuation (RMSF) to compare residue-specific flexibility with NMR dynamics parameters and crystallographic B-factors [68].
- Ensemble Validation: For NMR, compare the MD-generated ensemble with the experimental ensemble using metrics such as ensemble RMSD and the ability to satisfy experimental restraints [67] [68].
- Chemical Shift Prediction and Comparison: Use MD trajectories as input for machine learning-based chemical shift predictors (e.g., ShiftML2) to compute theoretical NMR chemical shifts for direct comparison with experimental values [70].
- Order Parameter Calculation: Derive (S^2) order parameters from MD trajectories using the sine and cosine of the dihedral angles or from atomic positional fluctuations for comparison with model-free analysis of NMR relaxation data [68].
- Cross-Correlation Analysis: Identify networks of correlated motions from MD trajectories and validate against NMR relaxation data and mutational studies that identify allosteric pathways [68].
The Scientist's Toolkit: Essential Research Reagents and Materials
Table 2: Key Research Reagents and Computational Tools
| Reagent/Tool | Function/Application | Technical Notes |
|---|---|---|
| Isotopically Labeled Media ((^{15}\mathrm{NH}_4\mathrm{Cl}), (^{13}\mathrm{C})-glucose) | Production of NMR-active protein samples for resonance assignment and dynamics studies [68] | Required for backbone and sidechain assignment; specific labeling schemes simplify spectra |
| Membrane Mimetics (DHPC, DPC, DDM, LCP) | Create native-like environments for membrane protein structure determination [67] | Choice of mimetic significantly impacts structure quality; LCP often superior for crystallization |
| Molecular Dynamics Software (GROMACS, AMBER, NAMD) | Run MD simulations with various force fields to model protein dynamics [70] | GROMACS offers high performance; AMBER force fields often used for biomolecules |
| Chemical Shift Predictors (ShiftML2) | Machine learning-based prediction of NMR chemical shifts from structural data [70] | Enables direct comparison of MD trajectories with experimental NMR spectra |
| Rosetta Molecular Modeling Suite | High-resolution structure refinement and protein design [67] | Particularly effective for refining membrane protein structures against sparse data |
| Force Fields (GAFF, CHARMM, AMBER) | Define potential energy functions for MD simulations [70] | GAFF commonly used for small molecules; protein-specific force fields continuously improving |
Advanced Applications in Drug Development
The integration of MD with experimental structural data has proven particularly valuable in pharmaceutical research, where understanding molecular recognition and dynamics directly impacts drug design.
Case Study: Amorphous Drug Form Characterization
Amorphous drug forms present significant characterization challenges due to their lack of long-range order. MD simulations combined with NMR have emerged as a powerful approach for understanding these materials:
- Model Generation: MD simulations generate representative models of amorphous systems by simulating rapid quenching from melt states or by using simulated annealing protocols [70].
- Dynamic Averaging: Chemical shifts are predicted for multiple snapshots across MD trajectories and averaged to account for the dynamic disorder inherent in amorphous materials [70].
- Tautomer Distribution Analysis: For drugs existing as tautomeric mixtures, MD simulations of different tautomeric states help interpret complex NMR spectra and quantify tautomer populations [70].
- Hydrogen Bonding Analysis: MD simulations provide detailed information on transient hydrogen bonding networks that explain downfield (^1\mathrm{H}) NMR chemical shifts observed in amorphous drugs [70].
Case Study: GTPase-Inhibitor Complex Characterization
In studies of the Gαi3 protein complex with the small molecule inhibitor IGGi-11, an integrated approach was essential for understanding molecular recognition:
- Flexibility Analysis: NMR spectroscopy identified flexible regions at the chain ends of Gαi3 that hindered crystallization [69].
- Truncation Strategy: Based on NMR data, flexible residues were removed to create a crystallization-optimized construct [69].
- Computational Docking and MD: When crystallography failed to reveal the bound inhibitor despite its presence in crystallization conditions, docking and MD simulations identified the binding interactions and revealed heterogeneous binding modes [69].
- Allosteric Mechanism Elucidation: Combined NMR and MD analyses revealed allosteric communication networks in GTPases that involve changes in protein dynamics without significant structural rearrangements [68].
Diagram 2: Drug development pipeline. This workflow shows how MD simulations complement experimental structural biology throughout the drug discovery process.
Molecular dynamics simulations, when rigorously validated against NMR and crystallographic data, provide an unparalleled computational microscope for studying biological macromolecules. The quantitative frameworks and methodologies outlined in this technical guide enable researchers to leverage the complementary strengths of computation and experiment—validating MD trajectories against experimental data while using MD to interpret and extend experimental observations. As MD simulations continue to increase in temporal and spatial scope, and as experimental methods provide ever more detailed structural and dynamic information, their synergistic integration will become increasingly essential for understanding complex biological processes and accelerating drug development. The future of this field lies in developing more sophisticated validation metrics that go beyond simple RMSD comparisons to capture the essential dynamics of biological systems, ultimately strengthening MD's role as a predictive computational microscope.
Molecular dynamics (MD) simulation serves as a powerful computational microscope, enabling researchers to visualize the dynamic motion of atoms and molecules with unprecedented temporal and spatial resolution. This virtual instrument provides atomistic insights into biological processes—including protein folding, ligand binding, and molecular recognition—that are often difficult to probe experimentally [3] [1]. The accuracy of this computational microscope, however, is fundamentally governed by the force field employed—the empirical mathematical functions that describe the potential energy of a molecular system as a sum of bonded and non-bonded interaction terms [71]. Among the numerous force fields developed, three families have dominated biomolecular simulations: AMBER, CHARMM, and GROMOS.
Each force field represents a distinct parameterization philosophy, balancing theoretical rigor against practical experimental data. The critical question for researchers is not which force field is universally "best," but which is most appropriate for their specific biological system and research questions. This review provides a comprehensive technical comparison of these three major force fields, evaluating their performance across diverse biomolecular systems within the broader context of MD as an essential tool for modern scientific discovery.
Methodological Approaches in Force Field Comparison
Benchmarking Strategies and Experimental Design
Rigorous comparison of force fields requires carefully designed benchmark studies that evaluate their performance against experimental data and across different molecular systems. The most informative studies employ multiple sequences with varied secondary structures and oligomerization states, simulating each system with different force fields while keeping all other simulation parameters constant [72]. This approach isolates the effect of the force field itself from other computational variables.
A representative comprehensive study simulated seven different β-peptide sequences composed of cyclic and acyclic β-amino acids, testing three force field families (AMBER, CHARMM, GROMOS) with specific modifications for β-peptides [72]. Each system was simulated for 500 nanoseconds, employing multiple starting conformations and, in some cases, studying oligomer formation from eight β-peptide monomers. This design allowed researchers to assess each force field's ability to accurately reproduce experimental structures and predict association behavior.
Quantitative Metrics for Evaluation
The performance of force fields is typically quantified using several key metrics:
- Structural accuracy: Root-mean-square deviation (RMSD) from experimental structures (e.g., from NMR or crystallography)
- Secondary structure stability: Ability to maintain known helical, sheet, or turn conformations
- Oligomer formation: Accurate prediction of self-assembly and complex stability
- Thermodynamic properties: Reproduction of liquid densities, vapor-liquid coexistence curves, and binding energies [73]
These quantitative metrics provide an objective basis for comparing force field performance across different molecular systems and simulation conditions.
Workflow for Comparative Force Field Validation
The diagram below illustrates the standard workflow for conducting a comparative force field validation study, from system preparation through final analysis.
Comparative Validation Workflow
Performance Comparison Across Biomolecular Systems
Accuracy for Proteins and Peptides
Modern force fields strive to achieve a delicate balance between accurately modeling folded protein stability and capturing the conformational dynamics of intrinsically disordered proteins (IDPs). Achieving this balance has proven challenging, as improvements in one area often come at the expense of the other [74].
Recent refinements to protein-water interactions and torsional parameters have yielded improved force field variants that better maintain this balance. For example, AMBER ff03ws and ff99SBws were developed through upscaling of protein-water interactions and adjustments to backbone torsion potentials, resulting in improved prediction of IDP dimensions while maintaining reasonable stability for folded proteins [74]. However, validation simulations have revealed that ff03ws exhibits significant instability for some folded proteins like Ubiquitin and Villin headpiece, while ff99SBws maintained structural integrity over microsecond timescales [74].
The CHARMM36m force field incorporates improved treatment of IDPs while reducing the tendency to form left-handed α-helices, demonstrating good performance for both folded and disordered proteins [74]. The GROMOS force fields, while less frequently updated for disordered proteins, maintain strengths in simulating folded protein structures under standard conditions.
Specialized Performance with Non-Natural Peptides
Comparative studies on β-peptides (non-natural peptides with widespread potential applications in nanotechnology and biomedical fields) reveal distinct performance differences among force fields. A 2023 systematic comparison examined seven β-peptide sequences with various secondary structures, including helical structures, sheet-like conformations, hairpins, and oligomeric bundles [72].
Table 1: Force Field Performance with β-Peptides
| Force Field | Overall Performance | Structures Accurately Reproduced | Oligomer Handling |
|---|---|---|---|
| CHARMM (modified) | Best overall | All monomeric experimental structures | Correctly described all oligomeric examples |
| AMBER | Mixed performance | Only those containing cyclic β-amino acids (4/7 sequences) | Maintained pre-formed associates but no spontaneous oligomer formation |
| GROMOS | Lowest performance | Limited to specific sequences (4/7) | Limited capability for association studies |
The study concluded that the CHARMM force field extension, based on torsional energy path matching against quantum-chemical calculations, performed best overall, while AMBER and GROMOS could only correctly treat a subset of the tested peptides without further parametrization [72].
Liquid State and Small Molecule Thermodynamics
Force fields are also validated against thermodynamic properties of small molecules and liquids, which provides insights into their fundamental non-bonded interaction parameters. A comprehensive study compared the AMBER, CHARMM, GROMOS, OPLS, TraPPE, and UFF force fields for predicting vapor-liquid coexistence curves and liquid densities [73].
Table 2: Performance for Liquid State Thermodynamics
| Force Field | Liquid Density Accuracy | Vapor Density Accuracy | Remarks |
|---|---|---|---|
| TraPPE | Best overall | Variable | Specifically designed for fluid phase equilibria |
| CHARMM | Nearly comparable to TraPPE | Moderate | Good choice for combined biological/thermodynamic studies |
| AMBER | Moderate | Best for vapor densities | Suitable when vapor phase accuracy is prioritized |
| GROMOS | Lower accuracy | Lower accuracy | Less reliable for thermodynamic properties |
The study noted that CHARMM performed notably well for liquid densities, being almost as accurate as TraPPE (which was specifically designed for fluid phase equilibria) across most error tolerances [73].
Research Reagent Solutions
Table 3: Essential Computational Tools for Force Field Studies
| Tool/Resource | Function | Application Context |
|---|---|---|
| GROMACS | High-performance MD simulation engine | Impartial comparison of different force fields using the same algorithms [72] |
| AMBER Software | Specialized MD package with optimized force fields | Production simulations requiring AMBER force field accuracy [75] |
| GAFF (Generalized Amber Force Field) | Parameters for small organic molecules | Drug discovery studies involving protein-ligand interactions [71] |
| CHARMM-GUI | Web-based interface for building complex systems | Preparation of membrane-protein systems for simulation with CHARMM force fields |
| gmxbatch | Python package for run preparation and trajectory analysis | Automation of simulation workflows and analysis pipelines [72] |
| pmlbeta | PyMOL extension for β-peptides | Molecular graphics and modeling of non-natural peptidomimetics [72] |
| MCCCS Towhee | Monte Carlo simulation package | Calculation of fluid phase equilibria for force field validation [73] |
Advanced Simulation Methodologies
Advanced sampling methods have become essential for addressing the timescale limitations of conventional MD. Gaussian accelerated MD (GaMD) is a particularly important technique that accelerates molecular dynamics simulations by smoothing potential energy surfaces and reducing energy barriers [1]. This method can accelerate simulations by thousands to millions of times, enabling the study of slow biological processes such as conformational transitions in CRISPR-Cas9 systems and drug binding/dissociation events [1].
Another innovative approach is Sensitivity Analysis, which evaluates the partial derivatives of simulation averages with respect to force field parameters. This provides the gradient of computed quantities in parameter space, guiding parameter adjustments to improve agreement with experimental data such as host-guest binding enthalpies [71].
Technical Protocols for Force Field Evaluation
Standardized β-Peptide Assessment Protocol
The following detailed methodology is adapted from the comprehensive comparison study cited in [72]:
System Preparation
- Build molecular models using molecular graphics software (e.g., PyMOL with specialized extensions for non-natural peptides)
- Generate molecular topologies using force field-specific tools (
pdb2gmxfor AMBER/CHARMM,make_topfor GROMOS) - Apply correct terminal groups matching experimental conditions
Simulation Setup
- Perform initial in vacuo energy minimization using steepest descent algorithm
- Set backbone torsion angles to desired secondary structure (folded or extended)
- Conduct another energy minimization to remove residual strain
- Solvate in appropriate box (cubic with at least 1.4 nm peptide-wall distance)
- For association studies: use 0.5 nm peptide-box distance and assemble eight copies in 2×2×2 cube with random rotations
- Add pre-equilibrated solvent (water, methanol, or DMSO) and ions
- For aqueous systems: add salt to 50 mM concentration
Equilibration Protocol
- Apply position restraints on peptide heavy atoms
- Perform steepest descent energy minimization on solvent/ions
- Conduct 100 ps NVT ensemble MD with weak coupling algorithm at 300 K (τ=1 ps coupling time)
Production Simulation
- Run unrestrained MD for sufficient duration (500 ns in reference study)
- Employ multiple replicas with different initial conditions where feasible
Analysis Metrics
- Calculate root-mean-square deviation from experimental structures
- Quantify secondary structure persistence using DSSP or similar algorithms
- Assess oligomer formation through intermolecular contacts and stability
Binding Affinity Calculation Protocol
For studies focusing on molecular recognition and drug design:
Binding Enthalpy Calculation
- Compute as difference between mean potential energy of solvated complex and separate simulations of solvated host and guest [71]
- Include pure solvent simulation to balance constituents of bound versus free states
Binding Free Energy Calculation
- Employ attach-pull-release (APR) approach or similar methods [71]
- Compute potentials of mean force along a path from bound to unbound states
- Ensure sufficient sampling of all intermediate states
The continuing evolution of molecular force fields represents a crucial endeavor to enhance the resolving power of the computational microscope. Our comparison demonstrates that while CHARMM currently shows particularly strong performance for β-peptides and balanced protein description, AMBER maintains advantages for specific biomolecular systems with its highly refined force fields, and GROMOS provides solid performance for standard folded proteins with good computational efficiency [72] [74] [75].
The future of force field development lies in addressing remaining limitations while expanding into new frontiers. Emerging approaches include:
- Integration of artificial intelligence: New AI force fields like GPTFF show promise for simulating arbitrary inorganic systems with high accuracy [76]
- Enhanced balance for diverse systems: Continued refinement to simultaneously describe folded proteins, IDPs, and molecular complexes without compromise [74]
- Expanded validation datasets: Incorporation of host-guest binding thermodynamics alongside traditional validation data [71]
- Quantum-mechanical integration: Increased use of QM/MM approaches for processes involving bond breaking/formation and electronic transitions
As these developments mature, the computational microscope will provide increasingly sharp views of molecular reality, further accelerating drug discovery, materials design, and fundamental biological understanding. The choice between AMBER, CHARMM, and GROMOS will continue to depend on the specific research question, but the overall trend points toward force fields with expanding applicability and increasingly quantitative accuracy.
Molecular dynamics (MD) simulations have emerged as a powerful "computational microscope," providing atomic-level resolution into biomolecular processes that are often inaccessible to experimental techniques [12]. However, research frequently encounters situations where simulation results appear to contradict experimental findings, creating interpretive challenges. This technical guide examines the principal sources of such divergence and presents structured methodologies for resolving ambiguous results. By examining case studies across protein dynamics, drug discovery, and materials science, we establish rigorous protocols for distinguishing between simulation artifacts and genuine biological phenomena. Our framework enables researchers to leverage discordant data as opportunities for deeper mechanistic insights, ultimately advancing the integration of computational and experimental approaches in molecular sciences.
Molecular dynamics simulations function as a computational microscope by predicting atomic trajectories based on physics-based force fields, effectively generating high-resolution "movies" of molecular behavior [12]. This approach captures biomolecular processes in full atomic detail at femtosecond resolution, revealing mechanisms underlying conformational changes, ligand binding, and molecular interactions [60]. The fundamental value of MD lies in its ability to complement experimental structural biology techniques—including cryo-EM, X-ray crystallography, and NMR—by adding temporal dynamics to static structural snapshots [12].
As with any microscope, the utility of MD depends on proper calibration and understanding of its limitations. When simulation and experiment diverge, researchers must determine whether discrepancies stem from technical artifacts or reveal previously unappreciated biology. This guide provides a systematic framework for making this critical distinction, enabling more effective integration of computational and experimental approaches in molecular research.
Technical and Methodological Limitations
Discrepancies between simulation and experimental results often originate from technical limitations in either approach. Understanding these constraints is essential for proper interpretation of apparently conflicting data.
Table 1: Technical Sources of Simulation-Experiment Divergence
| Source of Divergence | Impact on Results | Typical Manifestations |
|---|---|---|
| Force Field Imperfections | Inaccurate energetic representations | Non-native conformational preferences, incorrect folding pathways |
| Timescale Limitations | Incomplete sampling of rare events | Missing slow conformational changes, underestimated kinetics |
| Protonation State Errors | Incorrect charge distributions | Altered ligand binding affinities, distorted protein dynamics |
| Missing System Components | Over-simplified biological environment | Atypical solvation, missing allosteric regulation |
| Experimental Noise | Obscured "true" signal | Difficulty distinguishing signal from noise in ensemble measurements |
Force fields represent a particularly challenging area, as they provide approximate representations of molecular interactions. While modern force fields have improved dramatically, they still incorporate simplifications that can significantly impact results [12]. For example, classical force fields cannot naturally model bond formation and breaking, requiring specialized reactive force fields or QM/MM approaches for chemical reactions [77]. The choice of water model, treatment of long-range electrostatics, and parametrization of unusual cofactors or modified residues can all introduce systematic errors.
Meanwhile, experimental techniques face their own limitations. Ensemble measurements may average out important heterogeneities, while spatial and temporal resolution limits can obscure key intermediates. Cryo-EM and X-ray structures typically represent thermodynamic minima rather than dynamic ensembles, potentially missing transient but functionally important states [12].
Biological and Physical Considerations
Beyond technical factors, conceptual differences in what simulations and experiments actually measure can create apparent discrepancies.
- Timescale Disconnects: MD simulations typically access nanoseconds to microseconds, while many biologically important processes occur on millisecond to second timescales [12]. This sampling limitation means simulations may miss rare events critical to function.
- Ensemble vs. Single-Molecule Perspectives: Bulk experiments measure ensemble averages, while simulations provide complete atomic trajectories. A simulation might correctly capture individual molecular behaviors that are obscured in ensemble measurements [8].
- Environmental Simplifications: Many simulations employ idealized conditions that differ substantially from crowded cellular environments. The absence of molecular crowding, compartmentalization, or regulatory factors in simulations can significantly alter system behavior [78].
Diagnostic Methodologies for Investigating Divergence
Systematic Validation Workflow
When facing ambiguous results, researchers should implement a structured diagnostic approach to identify the source of discrepancy. The following workflow provides a systematic method for investigating divergence between simulation and experiment.
Diagram 1: Diagnostic workflow for investigating simulation-experiment divergence
Quantitative Validation Metrics
Robust validation requires quantitative metrics to compare simulation outcomes with experimental data. The following table outlines essential validation measurements and their interpretation.
Table 2: Key Validation Metrics for Simulation-Experiment Agreement
| Validation Metric | Experimental Reference | Acceptable Range | Interpretation Guide |
|---|---|---|---|
| RMSD (Protein Backbone) | Crystal structure | 1-3 Å | Values >3 Å suggest sampling issues or force field problems |
| RMSF (Residue Flexibility) | B-factors / NMR | Profile correlation >0.7 | Low correlation indicates inaccurate dynamics |
| Radius of Gyration | SAXS | Within 5% of experimental | Significant deviations suggest compaction/expansion |
| Solvent Accessible Surface | Chemical modification | Within 10% of expected | Systematic errors in packing or dynamics |
| NMR Order Parameters | NMR relaxation | Correlation >0.8 | Inaccurate sidechain dynamics |
| Distance Distributions | FRET/DEER | Overlap >0.8 | Incorrect conformational sampling |
Advanced validation approaches include dynamic cross-correlation maps (DCCM) to compare correlated motions with NMR data [78], and free energy calculations against experimental binding affinities or folding energies [60]. Principal component analysis (PCA) of simulation trajectories can be compared with experimental dimensionality reductions to validate collective motions [77].
Protocol for Resolving Divergence: Case Studies
Case Study 1: Alcohol Dehydrogenase Functional Divergence
In studies of alcohol dehydrogenase (ADH) enzymes across species, molecular dynamics simulations revealed evolutionary adaptations through type-I functional divergence analysis [78]. Researchers combined MD with phylogenetic analysis and network centrality measures to identify residues subject to selective pressures.
Experimental Protocol:
- System Preparation: Obtain PDB structures (e.g., 4W6Z, 1CDO, 1HDX) and prepare with appropriate protonation states
- Simulation Parameters: Perform 100ns MD simulations using NAMD with CHARMM36 force field, TIP3P water, PME electrostatics [78]
- Analysis Framework: Calculate dynamic cross-correlation maps (DCCM) using equation:
Cij = 〈Δri·Δrj〉/√(〈Δri²〉〈Δrj²〉)[78] - Network Analysis: Construct residue interaction networks and compute betweenness, closeness, and degree centralities
- Functional Divergence: Identify sites with significantly different evolutionary rates using DIVERGE software [78]
When initial simulations showed unexpected dynamic profiles compared to kinetic data, researchers implemented a residue-specific contact analysis that revealed previously uncharacterized allosteric networks, ultimately explaining the apparent discrepancy through long-range communication pathways.
Case Study 2: Drug Binding Kinetics and Energetics
In drug discovery applications, MD simulations frequently predict binding modes and affinities that conflict with experimental IC₅₀ values [60]. A robust protocol for addressing such discrepancies involves multi-scale validation.
Experimental Protocol:
- Enhanced Sampling: Implement Hamiltonian replica exchange or metadynamics to improve conformational sampling
- Free Energy Calculations: Perform alchemical free energy perturbations (FEP) with careful error analysis [60]
- Solvation Models: Compare implicit and explicit solvation treatments to identify hydration contributions
- Ensemble Docking: Dock against multiple conformational states from MD trajectories rather than single structures
- Experimental Cross-Validation: Design targeted mutations based on simulation predictions and test experimentally
This approach recently resolved apparent contradictions in kinase inhibitor binding by revealing the critical role of protein flexibility and water-mediated interactions that were missing in static crystal structures [60].
The Scientist's Toolkit: Essential Research Reagents and Solutions
Successful integration of simulation and experimental approaches requires specific computational and experimental resources. The following table details essential components of a modern molecular dynamics research pipeline.
Table 3: Key Research Reagent Solutions for MD-Experimental Integration
| Tool Category | Specific Examples | Function/Purpose | Implementation Considerations |
|---|---|---|---|
| Force Fields | CHARMM36, AMBER ff19SB, OPLS-AA/M | Define interatomic potentials | Choice depends on system; protein vs. nucleic acid vs. membrane |
| Water Models | TIP3P, TIP4P, SPC/E | Solvation environment | TIP3P most common; TIP4P often better for diffusion properties |
| Simulation Software | NAMD, GROMACS, AMBER, OpenMM | MD simulation engine | GROMACS for CPU efficiency; NAMD for GPU acceleration [78] |
| Enhanced Sampling | Metadynamics, Replica Exchange, Umbrella Sampling | Accelerate rare events | Collective variable choice critical for effectiveness |
| Analysis Tools | MDTraj, VMD, CPPTRAJ | Trajectory analysis | Scriptable interfaces enable reproducible analysis pipelines |
| Neural Network Potentials | EMFF-2025, ANI-nr, Deep Potential | Machine learning force fields | Bridge accuracy/efficiency gap; useful for reactive systems [77] |
| Experimental Validation | HDX-MS, smFRET, NMR relaxation | Validate simulation predictions | Provides ensemble and time-resolved data for comparison |
Emerging tools like neural network potentials (e.g., EMFF-2025) show particular promise for addressing systematic force field errors while maintaining computational efficiency [77]. These machine learning approaches can achieve density functional theory (DFT) level accuracy for specific molecular classes while remaining suitable for molecular dynamics simulations.
Advanced Integration Strategies and Future Directions
Multi-scale Modeling Frameworks
Increasingly sophisticated multi-scale approaches provide pathways for reconciling simulation and experimental data across spatial and temporal resolutions.
Diagram 2: Multi-scale modeling framework for integrating across resolutions
Machine Learning and Transfer Learning Approaches
Machine learning methods are increasingly bridging the gap between simulation and experiment. Neural network potentials like EMFF-2025 demonstrate how transfer learning can create generalizable force fields from minimal quantum mechanical data [77]. These approaches can predict structures, mechanical properties, and decomposition characteristics with DFT-level accuracy while remaining computationally efficient for molecular dynamics.
The integration of principal component analysis (PCA) and correlation heatmaps with machine learning potentials enables comprehensive mapping of chemical space and structural evolution [77]. This methodology recently uncovered surprising commonalities in high-temperature decomposition mechanisms across diverse high-energy materials, challenging conventional material-specific behavior paradigms.
Divergence between molecular dynamics simulations and experimental results represents not failure but opportunity—a chance to deepen our understanding of both computational methods and biological systems. By implementing the structured diagnostic approaches outlined in this guide, researchers can systematically investigate discrepancies, distinguish artifacts from genuine discovery, and advance integrative molecular science. As force fields continue to refine, sampling algorithms improve, and machine learning approaches mature, the gap between simulation and experiment will steadily narrow, enhancing the resolution of our computational microscope and revealing new vistas of molecular mechanism.
Molecular dynamics (MD) simulations have emerged as a powerful "computational microscope," enabling researchers to visualize molecular processes at an atomic level of detail. This whitepaper examines the growing predictive power of MD methodologies through case studies where simulations have made unrefuted discoveries that guide experimental research and drug development. By analyzing key successes in protein mechanics, GPCR-ligand interactions, and drug discovery, we demonstrate how state-of-the-art modeling alleviates prior concerns about timescale limitations, system size restrictions, and force field inaccuracies. The integration of MD with machine learning and specialized hardware now offers unprecedented opportunities for reliable prediction in biomedical research.
Molecular dynamics simulations serve as a computational microscope that provides astonishingly detailed "movies" of biomolecular behavior by calculating the time-evolved snapshots of atomic coordinates [3]. This approach allows researchers to extend static structural data into the dynamic domain, revealing mechanisms that are often difficult to probe experimentally [3]. Despite historical concerns about limited timescales, system sizes, and force field inaccuracies, advances in MD methodologies have established its value as a predictive tool that can make genuine discoveries without immediate experimental corroboration [3] [79].
The core strength of MD lies in its ability to bridge spatial and temporal gaps between experimental techniques. While cryo-EM and X-ray crystallography provide high-resolution structural data, they offer limited dynamic information [80]. Similarly, techniques like atomic force microscopy (AFM) and optical tweezers measure mechanical properties but lack atomic-level detail [3]. MD simulations complement these methods by providing the missing dynamic dimension, creating a complete picture of structure-function relationships in biomolecular systems.
Methodological Advances Enhancing MD Predictive Power
Timescale Acceleration Techniques
Traditional MD simulations face significant challenges in reaching biologically relevant timescales, as important cellular processes often occur over milliseconds to seconds [1]. To bridge this gap, several enhanced sampling methods have been developed:
Gaussian accelerated MD (GaMD): This technique smoothes potential energy surfaces, reducing energy barriers and accelerating simulations by thousands to millions of times [1]. GaMD has enabled the study of complex processes like CRISPR-Cas9 conformational transitions and ligand binding events that were previously inaccessible to simulation.
Steered MD (SMD): By applying carefully controlled external forces, SMD simulations mimic experimental force spectroscopy and naturally occurring cellular forces, allowing researchers to observe rare events like protein unfolding [3].
Machine Learning Integration
The integration of machine learning with MD has produced transformative improvements in both accuracy and efficiency:
Neural network potentials: Methods like DeePMD use deep neural networks to fit potential energy surfaces with quantum-mechanical accuracy while maintaining classical MD efficiency [81].
Hyper-predictive models: By incorporating MD-derived descriptors into quantitative structure-activity relationship (QSAR) models, researchers have created "hyper-predictive" computer models that significantly improve drug candidate prioritization [82].
Specialized Computing Architectures
Recent innovations in computing hardware have addressed fundamental efficiency limitations:
- Non von Neumann (NvN) architectures: These specialized computers mitigate the "memory wall bottleneck" of traditional computers by deploying multiplication-less deep neural networks on carefully optimized hardware [81]. This approach has demonstrated simultaneous achievement of ab-initio-level accuracy and classical MD efficiency.
Table 1: Key Methodological Advances in Molecular Dynamics
| Technique | Primary Innovation | Impact on Predictive Power |
|---|---|---|
| Gaussian accelerated MD (GaMD) | Potential energy surface smoothing | Accelerates simulations 10³-10⁷ fold; enables observation of rare events |
| Machine Learning MD (MLMD) | Neural network potentials | Achieves quantum accuracy with classical efficiency; reduces force field error |
| Non von Neumann MD (NVNMD) | Specialized computer architecture | Eliminates memory bottleneck; combines AIMD accuracy with CMD speed |
| Steered MD (SMD) | Application of external forces | Mimics force spectroscopy experiments; bridges timescale gaps |
Case Studies of Unrefuted MD Discoveries
Protein Mechanics and Force-bearing Mechanisms
MD simulations have provided fundamental insights into the mechanical properties of proteins that bear forces in cellular environments:
Titin Immunoglobulin Domains The muscle protein titin, responsible for passive elasticity in muscle fibers, consists of numerous immunoglobulin (Ig) and fibronectin-type-3 (FN3) domains [3]. SMD simulations revealed the hierarchical unfolding mechanism of these domains under mechanical stress, demonstrating how titin responds to stretching through domain reorientation followed by secondary structure rupture [3]. These simulations correctly predicted the mechanical unfolding pathways before detailed experimental verification, establishing MD as a reliable tool for studying protein elasticity.
Ankyrin and Cadherin Repeat Proteins Simulations of ankyrin and cadherin repeat proteins demonstrated how these structural motifs respond to mechanical forces [3] [79]. MD revealed the specific hydrogen bonding networks that confer mechanical stability and predicted the unfolding intermediates that were subsequently observed in single-molecule experiments. This work established fundamental principles for how repeat proteins balance stability and flexibility in mechanical signaling.
Table 2: Key Protein Systems Studied with MD Simulations
| Protein System | Biological Function | MD Discovery | Experimental Validation |
|---|---|---|---|
| Titin Ig domains | Muscle elasticity | Hierarchical unfolding mechanism | AFM force spectroscopy |
| Ankyrin repeats | Mechanical signaling | Hydrogen bond stabilization networks | Single-molecule experiments |
| Fibrinogen | Blood clot formation | Molecular basis of clot elasticity | AFM measurements |
| Cadherin | Cell adhesion | Force-dependent binding mechanisms | Optical tweezer studies |
GPCR-Ligand Binding Predictions
G protein-coupled receptors represent a particularly challenging class of drug targets due to their flexibility and complex binding modes. A systematic assessment of MD refinement for GPCR-ligand complexes demonstrated the predictive power of modern simulations:
D3 Dopamine Receptor Refinement In a landmark study, researchers used MD simulations to refine 30 models of the D3 dopamine receptor in complex with the antagonist eticlopride that were originally submitted to the GPCR Dock 2010 assessment [83]. Close to 60 μs of simulation time revealed that:
- MD refinement improved the accuracy of ligand binding mode predictions for a majority of models
- Application of weak restraints to transmembrane helices further enhanced predictions of ligand binding mode and extracellular loop conformations
- MD-refined models showed improved virtual screening performance for identifying active ligands [83]
This systematic evaluation demonstrated that MD simulations can correct errors in static homology models, particularly for difficult-to-predict regions like extracellular loops that directly participate in ligand binding.
Drug Discovery Applications
ERK2 Kinase Inhibitors Researchers integrated MD simulations with machine learning to create hyper-predictive models for ERK2 kinase inhibitors [82]. By running MD simulations for 87 known ERK2 inhibitors and computing dynamic descriptors from the trajectories, they developed models that accurately distinguished strong from weak inhibitors—a task that conventional 2D QSAR models and molecular docking failed to accomplish [82]. The MD descriptors provided unique insights into the interactions that make certain compounds potent inhibitors, guiding subsequent optimization efforts.
SARS-CoV-2 Drug Targets During the COVID-19 pandemic, GaMD simulations were used to study key viral drug targets, including the main protease and the human angiotensin-converting enzyme 2 (ACE2) receptor [1]. These simulations captured both binding and dissociation events of inhibitors, providing mechanistic insights that facilitated rational drug design for COVID-19 therapeutics.
Experimental Protocols and Methodologies
GPCR-Ligand Complex Refinement Protocol
The successful refinement of GPCR-ligand complexes followed a rigorous protocol [83]:
System Preparation
- Obtain initial receptor-ligand complex models (e.g., from homology modeling)
- Embed the complex in a lipid bilayer using 1-palmitoyl-2-oleoyl-sn-glycero-3-phosphocholine (POPC) lipids
- Solvate the system with water molecules and add appropriate ions to achieve physiological concentration
Simulation Parameters
- Apply two alternative force fields: OPLS-AA (in GROMACS) or CHARMM (in ACEMD)
- Perform energy minimization followed by gradual heating and equilibration
- Run production simulations for 100 ns with 2 fs timesteps
- Maintain constant temperature (300 K) and pressure (1 atm) using appropriate thermostats and barostats
Analysis Methodology
- Align trajectories to transmembrane domain backbone atoms
- Cluster snapshots based on ligand RMSD
- Select centroids of the five largest clusters for comparison to experimental structures
- Calculate RMSD values for transmembrane regions, extracellular loops, and ligand heavy atoms
Enhanced Sampling Protocol for Binding Events
For studying ligand binding and dissociation, advanced sampling protocols are required [1]:
Gaussian Accelerated MD Setup
- Identify essential collective variables that describe the binding process
- Calculate the average and standard deviation of the system potential energy
- Apply harmonic boost potential according to GaMD methodology
- Run multiple independent simulations to ensure adequate sampling
Analysis of Binding Mechanisms
- Identify metastable states through clustering analysis
- Calculate transition rates between states
- Map free energy landscapes from simulation data
- Validate predictions through comparison with experimental binding affinities
Diagram 1: MD Discovery Workflow - This diagram illustrates the generalized workflow for MD simulations that lead to unrefuted discoveries, from initial system setup through experimental validation.
The Scientist's Toolkit: Essential Research Reagents
Table 3: Essential Computational Tools for Predictive MD Simulations
| Tool Category | Specific Software/Hardware | Function in MD Workflow |
|---|---|---|
| Simulation Engines | GROMACS, NAMD, ACEMD, Desmond | Core MD simulation execution with various force fields |
| Enhanced Sampling | GaMD, SMD, MetaDynamics | Accelerate rare events and improve conformational sampling |
| Machine Learning | DeePMD, TensorFlow | Develop neural network potentials and analyze trajectories |
| Specialized Hardware | Non von Neumann computers, GPU clusters | Enable millisecond simulations with quantum accuracy |
| Analysis Tools | VMD, PyMOL, MDAnalysis | Visualize and quantify simulation trajectories |
| Force Fields | CHARMM, OPLS-AA, AMBER | Define molecular interactions and potential energy surfaces |
Validation Framework: Connecting Simulation and Experiment
The predictive power of MD simulations is ultimately determined through rigorous validation against experimental data:
Structural Validation
- Compare simulated conformations with crystal structures using RMSD metrics
- Assess conservation of key structural features (e.g., binding sites, secondary structure)
- Validate dynamic regions (loops, flexible domains) against experimental B-factors
Functional Validation
- Correlate computed binding free energies with experimental measurements
- Compare predicted unfolding forces with single-molecule experiments
- Validate mechanistic predictions through mutagenesis studies
Statistical Validation
- Perform multiple independent simulations to assess reproducibility
- Use clustering analysis to identify dominant conformational states
- Apply statistical measures to quantify uncertainty in predictions
Diagram 2: MD Validation Cycle - This diagram shows the iterative cycle between simulation and experiment that leads to validated discoveries, highlighting how predictions inform experimental validation which in turn refines computational models.
Molecular dynamics simulations have matured into a powerful predictive tool that can make unrefuted discoveries across diverse biological domains. Through case studies in protein mechanics, GPCR-ligand interactions, and drug discovery, we have demonstrated how MD serves as a computational microscope that reveals mechanistic insights inaccessible to experimental methods alone. The continued integration of MD with machine learning, enhanced sampling algorithms, and specialized computing hardware will further expand the predictive power of this methodology.
As MD simulations continue to bridge spatial and temporal gaps in experimental observations, they will play an increasingly vital role in rational drug design and fundamental biological discovery. The confidence in MD predictions has reached a point where simulations can genuinely guide experimental research, reducing the盲目性 (blindness) of experiments and accelerating the pace of scientific discovery. With ongoing advancements in force fields, sampling algorithms, and computing power, MD simulations are poised to become an indispensable tool for researchers and drug development professionals seeking to understand and manipulate biological systems at atomic resolution.
Conclusion
Molecular dynamics has firmly established itself as a transformative computational microscope, offering an unparalleled, atomistic view of biological mechanisms that directly informs drug discovery and basic research. While challenges in sampling, force field accuracy, and computational cost persist, continuous advancements in hardware, algorithms like GaMD, and force fields are steadily overcoming these hurdles. The future of MD lies in tighter integration with experimental data for validation and the increasing use of machine learning to enhance both speed and accuracy. For biomedical researchers, this powerful tool is no longer just a supplement but a critical partner for generating hypotheses, interpreting complex data, and accelerating the development of next-generation therapies, truly making the invisible world of molecular motion visible.
References
- 1. A “time-accelerated computational microscope” provides ... [https://www.advancedsciencenews.com/a-time-accelerated-computational-microscope-provides-biologists-with-powerful-insights/]
- 2. Available Instruments for Analyzing Molecular ... Dynamics Trajectories [https://pmc.ncbi.nlm.nih.gov/articles/PMC4797681/]
- 3. Discovery Through the Computational Microscope - PMC [https://pmc.ncbi.nlm.nih.gov/articles/PMC2927212/]
- 4. - Wikipedia Molecular dynamics [https://en.wikipedia.org/wiki/Molecular_dynamics]
- 5. From complex data to clear insights: visualizing molecular ... [https://pmc.ncbi.nlm.nih.gov/articles/PMC11043564/]
- 6. Comparison, Analysis, and Molecular Dynamics ... [https://pmc.ncbi.nlm.nih.gov/articles/PMC10525864/]
- 7. pDynamo - I. Molecular Dynamics [https://www.pdynamo.org/tutorials/molecular-dynamics]
- 8. Design principles for molecular animation [https://www.frontiersin.org/journals/bioinformatics/articles/10.3389/fbinf.2024.1353807/full]
- 9. Force field (chemistry) [https://en.wikipedia.org/wiki/Force_field_(chemistry)]
- 10. Towards exact molecular dynamics simulations with ... [https://www.nature.com/articles/s41467-018-06169-2]
- 11. molecular dynamics - What does "force field" mean? [https://mattermodeling.stackexchange.com/questions/7003/what-does-force-field-mean]
- 12. Molecular dynamics simulation for all - PMC - PubMed Central [https://pmc.ncbi.nlm.nih.gov/articles/PMC6209097/]
- 13. Molecular dynamics simulations of proteins: an in-depth ... [https://pubmed.ncbi.nlm.nih.gov/41003729/]
- 14. Centre for High Performance Computing 2025 National ... [https://events.chpc.ac.za/event/155/contributions/2611/]
- 15. Best CPU, GPU, RAM for Molecular Dynamics in 2024 ... [https://bizon-tech.com/blog/best-cpu-gpu-ram-for-molecular-dynamics?srsltid=AfmBOoqhoeasyReoZ4mXOI6knZxA9Wj2As-FWVh-1XeBefitnFqpezVP]
- 16. Advancements and Applications of Molecular Dynamics ... [https://www.musechem.com/blog/advancements-and-applications-of-molecular-dynamics-simulations-in-scientific-research/?srsltid=AfmBOoqBNsvUfHyuIM8IUynL2xBZPIB2ZhwyNZYQitLs8JDmKBKGF2-u]
- 17. MD Simulation Techniques and Applications [https://sites.psu.edu/simtech/]
- 18. Application of computational methods in the drug discovery ... [https://www.sciencedirect.com/science/article/pii/S2211383525005179]
- 19. Protocol for Molecular Dynamics Simulations of Proteins [https://en.bio-protocol.org/en/bpdetail?id=2051&type=0]
- 20. Machine learning analysis of molecular dynamics ... [https://www.nature.com/articles/s41598-025-11392-1]
- 21. Leveraging high-throughput molecular simulations and ... [https://www.nature.com/articles/s41524-025-01552-2]
- 22. MDCrow: Automating Molecular Dynamics Workflows with ... [https://arxiv.org/html/2502.09565v1]
- 23. Dynamics and Mechanisms of CRISPR-Cas9 through the ... [https://pmc.ncbi.nlm.nih.gov/articles/PMC9398989/]
- 24. Trajectory maps: molecular dynamics visualization and ... [https://pmc.ncbi.nlm.nih.gov/articles/PMC10789246/]
- 25. Dynamics and mechanisms of CRISPR-Cas9 through the ... [https://www.sciencedirect.com/science/article/abs/pii/S0959440X22000793]
- 26. Roles of Titin in the Structure and Elasticity of the Sarcomere [https://pmc.ncbi.nlm.nih.gov/articles/PMC2896707/]
- 27. Molecule of the Month: Titin - PDB-101 [https://pdb101.rcsb.org/motm/185]
- 28. A quantitative model for the dynamics of target recognition ... [https://www.nature.com/articles/s41467-022-35116-5]
- 29. Molecular dynamics simulations and drug discovery [https://bmcbiol.biomedcentral.com/articles/10.1186/1741-7007-9-71]
- 30. Structure and dynamics in drug discovery [https://www.nature.com/articles/s44386-024-00001-2]
- 31. Accelerating Molecular Dynamics Simulations for Drug ... [https://pubmed.ncbi.nlm.nih.gov/37676600/]
- 32. Predicting absolute ligand binding free energies to a simple ... [https://pmc.ncbi.nlm.nih.gov/articles/PMC2104542/]
- 33. Accurate absolute free energies for ligand–protein binding ... [https://www.nature.com/articles/s42004-021-00498-y]
- 34. Efficient Protein-Ligand Binding Free Energy Estimation ... [https://chemrxiv.org/engage/chemrxiv/article-details/68f75765aec32c65683d01e6]
- 35. Molecular dynamics-driven drug discovery [https://pubs.rsc.org/en/content/articlehtml/2025/cp/d5cp00380f]
- 36. Molecular Dynamics Simulations and Their Novel ... [https://pubmed.ncbi.nlm.nih.gov/41023346/]
- 37. Medical drug delivery analysis using molecular dynamics ... [https://www.sciencedirect.com/science/article/pii/S0254058425006480]
- 38. Molecular dynamic simulations of a hexagonal liquid ... [https://chemrxiv.org/engage/chemrxiv/article-details/67d32c3381d2151a02425e34]
- 39. Nanocarrier Drug Delivery Systems: Characterization ... [https://pmc.ncbi.nlm.nih.gov/articles/PMC9026217/]
- 40. Enhanced Sampling Techniques in Molecular Dynamics ... [https://pmc.ncbi.nlm.nih.gov/articles/PMC4339458/]
- 41. Running Gaussian-accelerated Molecular Dynamics ... [https://pmc.ncbi.nlm.nih.gov/articles/PMC12366796/]
- 42. Running Gaussian-accelerated Molecular Dynamics ... [https://livecomsjournal.org/index.php/livecoms/article/view/v6i1e3815]
- 43. GaMD | Miao Lab [https://www.med.unc.edu/pharm/miaolab/resources/gamd/]
- 44. Gaussian Accelerated Molecular Dynamics Simulations ... [https://www.mdpi.com/1422-0067/26/19/9325]
- 45. Bridging microscopy with molecular dynamics and ... [https://www.nature.com/articles/s41524-022-00733-7]
- 46. Challenges in protein folding simulations: Timescale, ... [https://pmc.ncbi.nlm.nih.gov/articles/PMC3032381/]
- 47. Long-timescale molecular dynamics simulations of protein ... [https://www.sciencedirect.com/science/article/abs/pii/S0959440X09000372]
- 48. Breaking timescale limits in MD simulations - Chemistry - Nature [http://chemistrycommunity.nature.com/users/420360-steffen-wolf/posts/breaking-timescale-limits-in-md-simulations]
- 49. Beating the Millisecond Barrier in Molecular Dynamics ... [https://pmc.ncbi.nlm.nih.gov/articles/PMC4302188/]
- 50. Challenges and opportunities in computational studies for ... [https://www.nature.com/articles/s44386-025-00024-3]
- 51. How quantum computing is changing drug development ... [https://www.weforum.org/stories/2025/01/quantum-computing-drug-development/]
- 52. Some practical approaches to treating electrostatic ... [https://pubmed.ncbi.nlm.nih.gov/24883956/]
- 53. A Fast, Convenient, Polarizable Electrostatic Model for ... [https://pmc.ncbi.nlm.nih.gov/articles/PMC10867846/]
- 54. Identifying Systematic Force Field Errors Using a 3D-RISM ... [https://pmc.ncbi.nlm.nih.gov/articles/PMC9921782/]
- 55. Assessing the effect of forcefield parameter sets on the ... - PMC [https://pmc.ncbi.nlm.nih.gov/articles/PMC9549959/]
- 56. Rapid parameterization of small molecules using the Force ... [https://pmc.ncbi.nlm.nih.gov/articles/PMC3874408/]
- 57. Data-driven parametrization of molecular mechanics force ... [https://pubs.rsc.org/en/content/articlehtml/2025/sc/d4sc06640e]
- 58. Molecular Dynamics Force Field Parameters for the EGFP ... [https://pmc.ncbi.nlm.nih.gov/articles/PMC10331734/]
- 59. Molecular Dynamics Simulations and Drug Discovery [https://pmc.ncbi.nlm.nih.gov/articles/PMC10705576/]
- 60. Molecular Dynamics Simulations in Drug Discovery and ... [https://www.mdpi.com/2227-9717/9/1/71]
- 61. Integrated Molecular Modeling and Machine Learning for ... [https://pmc.ncbi.nlm.nih.gov/articles/PMC10653122/]
- 62. Machine learning driven advances in molecular dynamics ... [https://chemrxiv.org/engage/chemrxiv/article-details/67c941a3fa469535b9277f64]
- 63. CUDA Refresher: Reviewing the Origins of GPU Computing [https://developer.nvidia.com/blog/cuda-refresher-reviewing-the-origins-of-gpu-computing/]
- 64. AMBER 24 NVIDIA GPU Benchmarks | B200, RTX PRO ... [https://www.exxactcorp.com/blog/molecular-dynamics/amber-molecular-dynamics-nvidia-gpu-benchmarks]
- 65. Integrating machine learning and molecular dynamics ... [https://www.nature.com/articles/s41598-025-25116-y]
- 66. Systematic Comparison of Crystal and NMR Protein ... [https://pmc.ncbi.nlm.nih.gov/articles/PMC3032220/]
- 67. Comparison of NMR and crystal structures of membrane ... [https://pmc.ncbi.nlm.nih.gov/articles/PMC5790426/]
- 68. Combining NMR and Molecular Dynamics Studies for Insights ... [https://pmc.ncbi.nlm.nih.gov/articles/PMC4269383/]
- 69. Integrated NMR-crystallography-computational approach ... [https://www.sciencedirect.com/science/article/pii/S0141813024097885]
- 70. The essential synergy of MD simulation and NMR in ... [https://pubs.rsc.org/en/content/articlehtml/2025/fd/d4fd00097h]
- 71. Toward Improved Force-Field Accuracy through Sensitivity ... [https://pmc.ncbi.nlm.nih.gov/articles/PMC4664157/]
- 72. Comparative Study of Molecular Mechanics Force Fields for β ... [https://pmc.ncbi.nlm.nih.gov/articles/PMC10302482/]
- 73. Comparison of the AMBER, CHARMM, COMPASS ... [https://www.sciencedirect.com/science/article/abs/pii/S0378381206003323]
- 74. Optimized protein-water interactions and torsional ... [https://www.nature.com/articles/s41467-025-65603-4]
- 75. AMBER vs GROMACS [https://diphyx.com/stories/amber-vs-gromacs/]
- 76. GPTFF: A high-accuracy out-of-the-box universal AI force ... [https://www.sciencedirect.com/science/article/pii/S2095927324006327]
- 77. EMFF-2025: a general neural network potential for ... [https://www.nature.com/articles/s41524-025-01809-w]
- 78. Computational Study of Network and Type-I Functional ... [https://www.mdpi.com/2218-273X/14/11/1473]
- 79. Review Discovery Through the Computational Microscope [https://www.sciencedirect.com/science/article/pii/S0969212609003323]
- 80. Recent advances in computational prediction of molecular ... [https://www.sciencedirect.com/science/article/abs/pii/S0963996924008469]
- 81. Accurate and efficient molecular dynamics based on ... [https://www.nature.com/articles/s41524-022-00773-z]
- 82. Researchers Use Molecular Dynamics and Machine Learning ... [https://news.ncsu.edu/2017/05/fourches-hyper-predictive-model/]
- 83. Can molecular dynamics simulations improve the structural ... [https://pmc.ncbi.nlm.nih.gov/articles/PMC8186765/]