Overcoming Sampling Limitations in Force Field Validation: Strategies for Reliable Biomolecular Simulations
Accurate molecular dynamics simulations are paramount for modern drug discovery and structural biology, yet their predictive power is critically limited by insufficient sampling and force field inaccuracies.
Overcoming Sampling Limitations in Force Field Validation: Strategies for Reliable Biomolecular Simulations
Abstract
Accurate molecular dynamics simulations are paramount for modern drug discovery and structural biology, yet their predictive power is critically limited by insufficient sampling and force field inaccuracies. This article provides a comprehensive framework for researchers and drug development professionals to navigate these challenges. We explore the fundamental origins of sampling limitations across diverse biological systems, from folded proteins to intrinsically disordered regions and RNA-ligand complexes. The review systematically evaluates advanced sampling methodologies, force field selection protocols, and robust validation techniques against experimental data. By synthesizing insights from recent benchmarking studies, we offer practical troubleshooting strategies and establish best practices for achieving statistically meaningful, experimentally-validated simulation results that can reliably guide biomedical research.
Understanding the Fundamental Sampling Challenge in Biomolecular Simulations
The Critical Impact of Sampling Limitations on Simulation Reliability
FAQs: Understanding Sampling and Its Challenges
Q1: What is meant by "sampling" in molecular simulations, and why is it a critical issue? In molecular dynamics (MD) and Monte Carlo (MC) simulations, "sampling" refers to the process of generating a representative set of configurations (a trajectory) from the full range of possible states of the system, weighted by their correct Boltzmann probability [1]. The central challenge is that many molecular systems of interest are highly complex, with rough energy landscapes and many local minima. Even with modern computing resources, simulations may not run long enough to overcome energy barriers and visit all relevant states [1] [2]. The usefulness of any simulated result ultimately hinges on the ability to confidently report uncertainties alongside predictions, which requires adequate sampling [1].
Q2: How can I tell if my simulation has been inadequately sampled? Inadequate sampling can manifest in several ways. Key indicators include:
- Poor Convergence of Observables: The estimated value of a property (e.g., average energy or radius of gyration) does not stabilize but instead drifts as the simulation continues.
- High Statistical Uncertainty: Calculations of the "experimental standard deviation of the mean" (often called the standard error) yield large error bars, indicating low confidence in the reported average [1].
- Failure to Replicate Known Experimental Behavior: For example, a simulation of an intrinsically disordered protein (IDP) like amyloid-β might produce an over-structured, collapsed ensemble that contradicts experimental NMR and FRET data showing it is a random coil [2].
- Low Replica Exchange Efficiency: In enhanced sampling methods like Temperature Replica Exchange (TREx), poor swapping rates between adjacent replicas indicate that the sampling is not efficiently exploring configuration space [2].
Q3: My simulation seems trapped in one conformational state. What can I do? This is a classic sampling problem. Solutions involve moving beyond standard MD:
- Employ Enhanced Sampling Methods: Techniques like Replica Exchange with Solute Tempering (REST) or metadynamics can help the system escape local energy minima [2] [3].
- Consider Advanced Algorithms: For systems with entropic barriers, such as IDPs, non-equilibrium methods like Temperature Cool Walking (TCW) have been shown to converge more quickly to the correct equilibrium distribution than TREx [2].
- Leverage Markov State Models (MSMs): Instead of one long simulation, run many shorter, independent simulations and use MSMs to reconstruct the long-timescale behavior and thermodynamics [2].
Q4: How does the choice of force field interact with sampling limitations? Force field accuracy and sampling adequacy are deeply intertwined. An inaccurate force field will yield incorrect results regardless of sampling. Conversely, even a perfect force field is useless without sufficient sampling to generate a representative ensemble [2]. This creates a "combined force field–sampling problem," where a perceived force field failure might actually be a sampling failure. For instance, short simulations or inefficient sampling protocols might incorrectly suggest a force field over-stabilizes certain structures, while more extensive sampling with the same force field reveals agreement with experiment [2].
Q5: What are the best practices for quantifying and reporting uncertainty from my simulations? Best practices advocate a tiered approach [1]:
- Feasibility Checks: Perform back-of-the-envelope calculations to determine if the desired computation is feasible.
- Semi-Quantitative Checks: Before final estimation, check for signs of inadequate sampling.
- Uncertainty Quantification (UQ): Use robust statistical techniques to derive "error bars." The "experimental standard deviation of the mean" is a common measure, but it must be calculated while accounting for correlation time in the data. Simply using every data point as independent will underestimate the true uncertainty [1]. Communicating the methods and assumptions used in your UQ analysis is critical.
Troubleshooting Guides
Issue: Over-Structured Disordered Proteins
Problem: Simulations of intrinsically disordered proteins (IDPs) like amyloid-β or ACTR result in overly collapsed, rigid conformations with excess secondary structure, contradicting experimental evidence [2] [4].
Diagnosis: This is a common symptom of the combined force field–sampling problem. The force field may have a bias, or the sampling may be insufficient to escape low-energy kinetic traps.
Solutions:
- Validate with Multiple Experiments: Compare your simulated ensemble against a variety of experimental data, such as NMR J-couplings, chemical shifts, FRET efficiency, and radius of gyration (Rg) [2] [5].
- Upgrade Your Sampling Protocol: Move beyond simple MD. Implement enhanced sampling methods designed for flatter energy landscapes. Temperature Cool Walking (TCW) has shown success for Aβ peptides, and Markov State Models (MSMs) built from many simulations can yield correct random coil ensembles where shorter runs fail [2].
- Evaluate Your Force Field: Test a newer force field specifically optimized for disordered proteins (e.g., a99SB-disp) [4]. Be aware that implicit solvent models often exacerbate over-compaction and may require specific parameterization for IDPs [4].
Issue: Poor Convergence in Free Energy Calculations
Problem: Relative binding free energy (RBFE) calculations, used in drug discovery, show high variance and poor convergence, making it difficult to predict ligand affinity reliably [3].
Diagnosis: Inadequate sampling of relevant ligand and protein conformational states during the alchemical transformation. Large energy barriers can trap the system.
Solutions:
- Implement Hamiltonian Replica Exchange: Use methods like REST (Replica Exchange with Solute Tempering) to enhance sampling along the alchemical λ pathway, helping to overcome barriers between different conformations [3].
- Ensure Technical Accuracy: Use automated, well-validated workflows (e.g., with OpenMM) to minimize setup errors. Carefully prepare the protein, assign correct partial charges (AM1-BCC or RESP), and select an appropriate water model (e.g., TIP3P, SPC/E) [3].
- Extend Simulation Time: If uncertainty remains high after enabling replica exchange, increase the simulation time per λ window.
Issue: Force Field Validation Yields Inconsistent Results
Problem: When validating a force field on a test system (e.g., a small protein), the results are highly variable between different simulation runs and do not consistently match experimental data.
Diagnosis: The sampling time is likely shorter than the slowest relaxation time of the system. What appears to be a force field error may be a lack of conformational sampling.
Solutions:
- Conduct Extensive Sampling: For force field validation, it is critical to sample the test systems as extensively as possible. Use long simulation times (e.g., 10+ µs for small folded proteins) to ensure the level of agreement with experiment is a true measure of force field accuracy [5] [6].
- Test on Multiple Systems: Validate force fields across a diverse set of proteins and peptides (folded proteins, helical peptides, β-hairpins) to check for biases toward specific secondary structures [5] [6].
- Quantify Statistical Uncertainty: Always report uncertainty estimates (e.g., standard error) for any simulated observable to communicate the confidence in your results [1].
Quantitative Data on Sampling Impact
The table below summarizes quantitative findings from studies that highlight the direct impact of sampling methodology on simulation outcomes.
Table 1: Impact of Sampling Method on Simulated Protein Ensembles
| Protein System | Sampling Method | Key Result | Experimental Reference | Citation |
|---|---|---|---|---|
| Amyloid-β (Aβ42/Aβ43) | Temperature Replica Exchange (TREx) | Over-structured ensembles; poor agreement with NMR/FRET | Roche et al.; Meng et al. | [2] |
| Amyloid-β (Aβ42) | Temperature Cool Walking (TCW) | Random coil ensembles; very good agreement with NMR/FRET | Roche et al.; Meng et al. | [2] |
| Amyloid-β (Aβ42) | ~200 µs MD + Markov State Model (MSM) | Extended, largely unstructured conformations (~10-20% helix); good agreement with experiment | Roche et al.; Meng et al. | [2] |
| Amyloid-β (Aβ40) | Single 30 µs trajectory (Amber99ffsb-ildn*/TIP3P) | ~90% β-sheet structure; disagrees with experiment | Roche et al. | [2] |
| Folded Proteins (Ubiquitin, GB3) | 10 µs MD per force field | Native state stable in 7 of 8 force fields; one (CHARMM22) unfolded | NMR data | [5] [6] |
Experimental Protocols for Assessing Sampling
Protocol: Quantifying Statistical Uncertainty and Correlation Time
This methodology is essential for reporting reliable results from any MD or MC simulation [1].
- Run Production Simulation: Generate a continuous trajectory of your property of interest (e.g., potential energy, Rg).
- Check for Equilibration: Discard the initial non-equilibrated portion of the trajectory.
- Calculate the Arithmetic Mean:
- For
nobservations, calculate:x̄ = (1/n) * Σ(x_j)
- For
- Calculate the Experimental Standard Deviation:
s(x) = sqrt( [ Σ(x_j - x̄)² ] / (n - 1) )
- Account for Correlation Time (τ): Time-series data from simulations are rarely independent. The correlation time is the longest separation at which observations are still correlated. Failing to account for this leads to underestimated errors.
- Calculate the Experimental Standard Deviation of the Mean (Standard Error):
- With correlation, the effective number of independent samples is
n_eff = n / (2τ). - The standard error is then:
s(x̄) = s(x) / sqrt(n_eff) - This
s(x̄)is your standard uncertainty for the reported mean.
- With correlation, the effective number of independent samples is
Protocol: Validating a Force Field for Disordered Proteins
This protocol uses a multi-faceted experimental comparison to rigorously test a force field and sampling method for IDPs [2] [4].
- System Preparation: Select an IDP with robust experimental data (e.g., Aβ42, ACTR). Set up the simulation with the chosen force field and water model.
- Enhanced Sampling Simulation: Run simulations using an enhanced sampling method (e.g., TCW, REST, or long MD with MSM analysis). For comparative studies, run the same system with multiple sampling protocols.
- Analyze Structural Ensemble:
- Calculate the radius of gyration (Rg) distribution.
- Calculate the secondary structure content over time.
- Identify persistent long-range contacts.
- Compare with Experimental Data:
- NMR: Back-calculate NMR chemical shifts and J-couplings from your ensemble and compare directly to experimental values [2] [5].
- FRET: Compute FRET efficiencies from your simulated distances and compare to single-molecule FRET data [2].
- SAXS: Calculate the theoretical SAXS profile from your ensemble and compare to the experimental scattering profile [2].
- Evaluate Agreement: A well-sampled simulation with an accurate force field will produce an ensemble that simultaneously agrees with all these experimental metrics, showing a dominant random coil character for canonical IDPs.
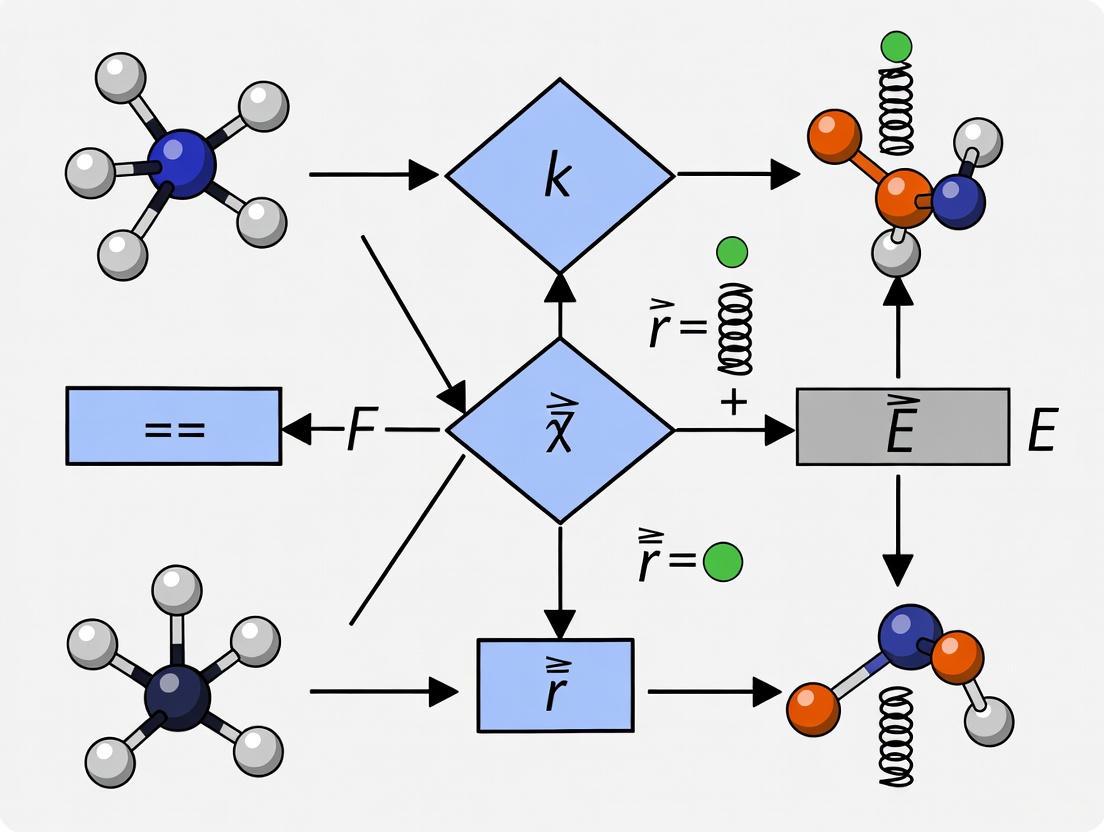
Workflow Diagram
The following diagram illustrates the integrated process of diagnosing and addressing sampling limitations in force field validation.
Diagram: Workflow for Addressing Sampling Limitations. This chart outlines the logical process for diagnosing sampling issues, implementing solutions, and validating the final result.
The Scientist's Toolkit
Table 2: Essential Research Reagents and Computational Tools
| Tool/Solution | Function / Purpose | Example Use Case | Citation |
|---|---|---|---|
| Enhanced Sampling Algorithms | Accelerate barrier crossing and improve conformational sampling. | ||
| - Temperature Replica Exchange (TREx) | Parallel simulations at different temperatures swap configurations. | Common initial choice for IDP studies, but can be inefficient. | [2] |
| - Temperature Cool Walking (TCW) | Non-equilibrium method using one high-T replica to generate trial moves. | Can provide faster convergence for IDPs like amyloid-β. | [2] |
| - Replica Exchange with Solute Tempering (REST) | Reduces the number of replicas by tempering only the solute-solute and solute-solvent interactions. | Enhances sampling in binding sites for protein-ligand FEP calculations. | [3] |
| Analysis Frameworks | Extract thermodynamic and kinetic information from simulation data. | ||
| - Markov State Models (MSMs) | Build a kinetic model from many short simulations to describe long-timescale behavior. | Characterizing the full folding pathway of proteins and IDPs. | [2] |
| - Uncertainty Quantification (UQ) Tools | Statistical methods (e.g., block averaging, autocorrelation) to calculate standard error. | Essential for reporting statistically robust results in any publication. | [1] |
| Validation Data Sources | Experimental data used to validate the accuracy of simulated ensembles. | ||
| - NMR (J-couplings, NOEs, CS) | Provides atomic-level information on structure and dynamics. | Gold standard for validating folded state dynamics and IDP randomness. | [2] [5] |
| - Single-Molecule FRET | Measures distance distributions in biomolecules. | Ideal for validating the global dimensions of IDPs. | [2] |
| Specialized Force Fields | Parameter sets designed for specific challenges. | ||
| - a99SB-disp | Explicit solvent force field for folded and disordered proteins. | Used as a baseline for developing improved implicit solvent models. | [4] |
| - GB99dms | Improved implicit solvent force field for disordered proteins. | Studying protein aggregation with implicit solvent. | [4] |
Frequently Asked Questions (FAQs) and Troubleshooting Guides
FAQ: Core Concepts and Selection
Q1: What are the key limitations of current force fields when studying non-standard systems like RNA-ligand complexes or bacterial membranes?
Current force fields, while generally effective for standard protein structures, show specific limitations in more complex systems. For RNA-ligand complexes, state-of-the-art force fields can stabilize RNA structures but often at the expense of distorting the experimental model or failing to consistently maintain stable RNA-ligand interactions. Further refinements are needed to accurately reproduce experimental observations of binding stability [7]. For specialized systems like mycobacterial membranes, general force fields (GAFF, CGenFF, OPLS) lack the dedicated parameters for unique bacterial lipids, leading to inaccurate predictions of key membrane properties such as lipid tail rigidity and diffusion rates. Specialized force fields like BLipidFF are required to capture these biophysical characteristics accurately [8].
Q2: How do I choose an appropriate force field for simulating drug-like small molecules?
Validation studies against experimental data, such as osmotic coefficients, are crucial for selecting a force field for drug-like molecules. Several generalized force fields have been tested for this purpose [9]:
- Generally Reliable: GAFF, GAFF2, CGenFF, and OPLS-AA generally produce results in good agreement with experimental osmotic coefficients.
- Use with Caution: PRODRGFF often produces poor agreement with experimental data and should be avoided or its parameters carefully validated.
- Known Issues: All tested force fields (GAFF, CGenFF, OPLS-AA, PRODRGFF) poorly reproduced experimental results for purine-derived molecules (e.g., purine, caffeine), indicating a common challenge with this chemical class [9].
For the most up-to-date and accurate parameters, consider modern data-driven force fields like ByteFF, which are trained on expansive, diverse quantum chemical datasets to provide broad coverage of drug-like chemical space [10].
Q3: What are the best practices for validating a force field for my specific system?
Force field validation should involve comparisons against relevant experimental data for your system of interest. The specific benchmarks depend on the molecular type:
- For Folded Proteins: Compare simulation results to experimental NMR data, including structural data (e.g., chemical shifts) and dynamical properties (e.g., order parameters). Testing a force field's bias towards different secondary structures using small peptides and assessing its ability to fold small proteins are also critical strategies [5].
- For Intrinsically Disordered Regions (IDRs): Validate against experimental data that reports on ensemble dimensions, such as the radius of gyration (Rg) from Small-Angle X-Ray Scattering (SAXS) or data from single-molecule FRET (smFRET). The accuracy of force fields like Mpipi and its variants is often judged by their ability to recapitulate a curated set of experimental Rg values [11].
- For Small Molecules: Calculate physical properties like osmotic coefficients from simulation and compare them directly to experimental measurements [9].
FAQ: Troubleshooting Common Problems
Q1: My RNA-small molecule complex becomes unstable during simulation, with the ligand drifting away from its binding site. What could be wrong?
This is a recognized challenge. Your troubleshooting should consider:
- Force Field Choice: The latest RNA force fields may still not perfectly reproduce experimental binding stability. Consult recent systematic assessments to select the most reliable one for your specific complex [7].
- Initial Experimental Structure: Be cautious when assuming the experimental PDB structure is the definitive conformation. Some local distortions in the deposited model may result from refinement under limited experimental restraints. The force field might be attempting to correct these, leading to apparent instability. Analyze which parts of the structure are well-supported by direct experimental data [7].
- Parametrization of the Ligand: Ensure the small molecule parameters are derived from a robust protocol, such as using GAFF2 with RESP2 charges, to avoid introducing noise from poor ligand parametrization [7].
Q2: I am simulating a system with an intrinsically disordered protein (IDP), but the computed radius of gyration does not match experimental SAXS data. How can I resolve this?
A discrepancy between simulated and experimental Rg suggests a problem with the force field's description of the IDR's sequence-ensemble relationship.
- Switch to a Validated Coarse-Grained Force Field: All-atom force fields developed for folded proteins may not capture IDR physics correctly. Use a coarse-grained force field specifically designed and validated for disordered proteins, such as Mpipi or CALVADOS [11].
- Consider Force Field Fine-Tuning: Even specialized force fields may require minor adjustments. For example, the Mpipi-GG variant was created to improve agreement with known experimental trends for IDR dimensions [11].
- Use a Rapid Predictor for Hypothesis Testing: Tools like ALBATROSS can predict IDR conformational properties (Rg, end-to-end distance) directly from sequence in seconds. Use it to quickly test if your simulated Rg is an expected outcome of the sequence or a clear outlier, which would point to a force field issue [11].
Q3: Parameterizing a custom small molecule force field is tedious and expensive. Are there more efficient modern approaches?
Yes, traditional single-molecule force field fitting is being replaced by automated, data-driven methods.
- Iterative Optimization: New automated procedures can optimize parameters against quantum mechanical (QM) data, run dynamics to sample new conformations, add the new data to the training set, and repeat the optimization until convergence. This iterative process, using a validation set to prevent overfitting, is more efficient and thorough than manual methods [12].
- Graph Neural Networks (GNNs): Modern approaches use GNNs to predict all bonded and non-bonded force field parameters simultaneously. Models like ByteFF and Espaloma are trained on millions of QM-derived molecular geometries and torsion profiles, providing accurate parameters that respect chemical symmetry and cover a vast chemical space, often eliminating the need for custom parametrization [10].
Experimental Protocols and Methodologies
Detailed Workflow: Systematic Force Field Validation for Proteins
This protocol, adapted from a landmark study, provides a framework for rigorously testing protein force fields against experimental data [5].
1. Objective: To systematically evaluate the accuracy of multiple protein force fields in describing the structure, dynamics, and folding behavior of proteins and peptides.
2. Key Components of the Validation Suite:
- Folded Proteins: Simulate well-characterized, stable proteins (e.g., ubiquitin, GB3) for which high-quality NMR data is available.
- Secondary Structure Propensity: Use small peptides known to preferentially populate specific secondary structures (e.g., helical vs. sheet-forming).
- Folding Ability: Test the force field's ability to fold an α-helical and a β-sheet protein from an unfolded state.
3. Methodology:
- System Preparation:
- Obtain starting structures from the Protein Data Bank (PDB).
- Use simulation software such as AMBER, GROMACS, or CHARMM.
- Solvate the protein in an appropriate water box (e.g., TIP3P, OPC) and add ions to neutralize the system and achieve a physiological concentration.
- Simulation Details:
- Run multiple, long-timescale (microsecond to millisecond) unrestrained molecular dynamics simulations for each force field under test.
- Perform simulations under NPT conditions (constant Number of particles, Pressure, and Temperature), e.g., 1 atm and 298 K.
- Use a thermostat (e.g., Langevin, velocity-rescale) and a barostat (e.g., Berendsen, Parrinello-Rahman).
- Data Analysis and Comparison to Experiment:
- Folded State Stability: Calculate the backbone root-mean-square deviation (RMSD) relative to the experimental structure over the simulation trajectory.
- Structure and Dynamics: Compare simulation-derived NMR observables (e.g., chemical shifts, J-couplings, residual dipolar couplings, order parameters) directly to experimental NMR data.
- Contact Maps: Generate residue-residue contact maps from the simulation trajectory and compare them to those from the experimental structure.
- Folding Analysis: For folding tests, monitor metrics like RMSD and fraction of native contacts to determine if the protein folds to the native state.
Detailed Workflow: Parameterizing a Force Field for Unique Bacterial Lipids
This protocol outlines the specialized process used to create the BLipidFF force field for mycobacterial membrane lipids [8].
1. Objective: To develop accurate atomic-level force field parameters for complex bacterial lipids that are poorly described by general force fields.
2. Methodology:
- Atom Type Definition:
- Define specialized atom types based on location and chemical environment (e.g.,
cTfor tail carbon,cAfor headgroup carbon,oSfor ether oxygen).
- Define specialized atom types based on location and chemical environment (e.g.,
- Partial Charge Calculation:
- Divide-and-Conquer: Fragment the large lipid molecule into smaller, manageable segments.
- Quantum Mechanics (QM) Calculations: For each segment:
- Perform geometry optimization at the B3LYP/def2SVP level of theory.
- Derive partial charges using the Restrained Electrostatic Potential (RESP) fitting method at the B3LYP/def2TZVP level.
- Averaging: Use multiple conformations (e.g., 25) from preliminary MD simulations for each segment and average the RESP charges to account for flexibility.
- Integration: Combine the charges of all segments, removing capping groups, to obtain the total charge for the full lipid.
- Torsion Parameter Optimization:
- Further subdivide the lipid molecule into small elements for torsion parameterization.
- Optimize torsion parameters (Vn, n, γ) to minimize the difference between the QM-calculated energy and the classical potential energy.
- For other parameters (bonds, angles), adopt them from a established general force field like GAFF.
- Validation:
- Run MD simulations of lipid bilayers using the new parameters.
- Compare simulation predictions (e.g., lateral diffusion coefficients, order parameters) to biophysical experimental data such as Fluorescence Recovery After Photobleaching (FRAP) and fluorescence spectroscopy measurements.
Data Presentation
Table 1: Performance of Generalized Force Fields for Drug-like Molecules
Table based on testing against experimental osmotic coefficient data [9].
| Force Field | Overall Agreement with Experiment | Notes and Known Limitations |
|---|---|---|
| GAFF / GAFF2 | Good | GAFF2 shows slightly improved agreement over GAFF. Reliable for many drug-like molecules. |
| CGenFF | Good | Generally produces accurate osmotic coefficients. |
| OPLS-AA | Good | A robust choice for small molecule simulation. |
| PRODRGFF | Poor | Often produces poor results; not recommended without careful reparameterization. |
| All Tested FFs | Poor for purines | All force fields performed poorly for purine-derived molecules (e.g., caffeine). |
Table 2: Essential Research Reagents and Computational Tools
Compilation of key software, force fields, and resources mentioned in current literature.
| Reagent / Tool | Function / Purpose | Key Application Context |
|---|---|---|
| ByteFF | A data-driven, Amber-compatible small molecule force field. | Predicts MM parameters for drug-like molecules across expansive chemical space [10]. |
| BLipidFF | A specialized all-atom force field for bacterial lipids. | Accurately simulates mycobacterial outer membrane properties [8]. |
| ALBATROSS | A deep learning model for predicting IDR properties. | Rapidly predicts radius of gyration and other ensemble dimensions directly from sequence [11]. |
| Mpipi / Mpipi-GG | A coarse-grained force field for disordered proteins. | Simulating conformational ensembles of Intrinsically Disordered Regions (IDRs) [11]. |
| OMol25 Dataset | A massive dataset of high-accuracy quantum chemical calculations. | Training and validating next-generation neural network potentials (NNPs) [13]. |
| HARIBOSS | A curated database of RNA-small molecule complexes. | Provides structures for testing and validating RNA-ligand force fields [7]. |
Methodologies and Workflow Visualization
Force Field Selection and Validation Workflow
Data-Driven Force Field Parameterization
Troubleshooting Guide: Addressing Common Force Field Challenges
This guide helps users diagnose and resolve frequent issues encountered when simulating RNA-ligand complexes.
Problem 1: Overly Compact or Non-Native RNA Structures
- Problem Description: Simulations result in RNA structures that are excessively compact, show artificial base stacking, or generate intercalated structures rarely observed in experiments [2] [14].
- Potential Causes:
- Use of a standard protein force field not optimized for RNA, leading to a bias toward collapsed ensembles [2].
- Inadequate sampling of the RNA's conformational landscape, causing the simulation to be trapped in non-representative states [2].
- Improper description of the solvation environment or ion interactions for the highly charged RNA backbone [15].
- Solutions:
- Switch to a Refined RNA Force Field: Utilize modern, RNA-specific force fields like BSFF1, which was developed to mitigate overestimation of base-stacking and reduce artificial intercalated conformations [14].
- Implement Enhanced Sampling: Employ advanced sampling algorithms like Temperature Cool Walking (TCW) or Replica Exchange with Solute Tempering (REST2), which can provide better convergence to the correct equilibrium distribution than standard temperature replica exchange (TREx) for disordered systems [2] [14].
- Extend Sampling Time: If possible, combine extensive molecular dynamics (MD) simulations with Markov State Model (MSM) analysis to achieve more complete sampling [2].
Problem 2: Inaccurate Ligand Binding Poses and Affinities
- Problem Description: Docking or MD simulations fail to reproduce experimentally observed ligand binding modes or predict binding affinities inaccurately [15].
- Potential Causes:
- Insufficient RNA Flexibility: The RNA receptor is treated as rigid, ignoring ligand-induced conformational changes [15].
- Limitations in Scoring Functions: The scoring function does not adequately capture key interactions, such as those mediated by metal ions or the highly polar RNA environment [15].
- Neglect of Electrostatic and Solvation Effects: Inaccurate treatment of the strong electrostatic interactions involving the RNA backbone and bound ions [15] [16].
- Solutions:
- Incorporate Receptor Flexibility: Use docking protocols that allow for flexibility in the RNA target, or run MD simulations to generate an ensemble of RNA conformations for docking [15].
- Utilize Advanced Scoring: Consider physics-based or hybrid knowledge-based/physics-based scoring functions that can better handle the unique challenges of RNA-ligand binding [15].
- Explicitly Model Ions and Water: Ensure the simulation system includes necessary metal ions (e.g., Mg²⁺) and uses appropriate water models, as these are critical for stabilizing RNA structure and ligand binding [15].
Problem 3: Instability of RNA-Protein Complexes
- Problem Description: During simulations of RNA-protein complexes, the complex structure disintegrates, particularly in flexible loop regions [16].
- Potential Causes:
- Use of Polarizable Force Fields: While polarizable force fields (like AMOEBA) can better describe the strong electrostatic nature of RNA, they may also allow for excessive movement that can destabilize complex structures over longer timescales [16].
- Force Field Incompatibility: Using a combination of protein and RNA force fields that have not been rigorously tested together [16].
- Solutions:
- Test Multiple Force Fields: Begin simulations by testing different combinations of well-regarded non-polarizable force fields (e.g., Amber's ff19SB for protein with OL3 for RNA). If using polarizable force fields, closely monitor the structural integrity of the complex [16].
- Consider Polarizable Water Models: As a compromise, using a polarizable water model (like O3P) with non-polarizable force fields can improve the description of electrostatics without the full computational cost and potential instability of a fully polarizable force field [16].
Frequently Asked Questions (FAQs)
Q1: What are the main limitations of current force fields when simulating RNA-ligand complexes? The primary limitations include:
- Sampling Problem: The timescale of simulations is often insufficient to capture the full conformational landscape of flexible RNA molecules [14].
- Force Field Problem: The potential energy functions may have biases, such as overestimating base-stacking propensity and generating non-native intercalated structures [14].
- Electrostatics: The highly charged RNA backbone requires an accurate description of interactions with metal ions and solvent, which is challenging for non-polarizable force fields [15] [16].
- Data Scarcity: Compared to proteins, there are fewer experimentally determined RNA and RNA-ligand complex structures, which limits the development of knowledge-based parameters [15].
Q2: My simulation of an Aβ peptide is too structured, contradicting experimental data. What should I do? This is a known issue. The problem likely stems from a combination of force field and sampling limitations [2]. Solutions include:
- Re-evaluate Your Sampling Protocol: Standard Temperature Replica Exchange (TREx) may be insufficient. Consider switching to non-equilibrium methods like Temperature Cool Walking (TCW), which has been shown to produce more accurate, random-coil-like ensembles for Aβ peptides [2].
- Test Newer Force Fields: Explore the use of newer fixed-charge force fields that have been specifically optimized for intrinsically disordered proteins (IDPs) and unfolded states [2].
Q3: What advanced parameterization methods can make force fields more accurate? Bayesian inference methods are powerful for refining force fields against experimental data.
- Bayesian Sampling: This approach explores the parameter landscape with respect to physical properties, treating uncertainty in experimental data as a part of the optimization process. It can use surrogate models (like Gaussian Processes) to speed up the evaluation of physical properties from simulation [17].
- BICePs (Bayesian Inference of Conformational Populations): This algorithm refines force field parameters against sparse or noisy ensemble-averaged experimental data. It samples the full posterior distribution of uncertainties and can automatically detect and down-weight outlier data points, leading to more robust parameterization [18].
Key Experimental Protocols and Data
Development of the BSFF1 RNA Force Field
The BSFF1 force field was developed to address over-stacking and intercalation artifacts [14].
- Objective: To improve the conformational sampling of RNA by optimizing parameters within the framework of the ff99bsc0χOL3 force field [14].
- Methodology: A two-step strategy was employed:
- Nonbonded Parameter Optimization: The Lennard-Jones epsilon (ε) parameters for heavy atoms in nucleobases were base-specifically adjusted. Optimization was performed using a reweighting method combined with a Monte Carlo Simulated Annealing (MCSA) procedure, based on REST2-enhanced sampling simulations of tetranucleotides. The goal was to minimize the ratio of non-native intercalated conformations [14].
- Introduction of a CMAP Term: A grid-based energy correction map (CMAP) term was added to better reproduce the distributions of the ζ/α dihedral angles [14].
- Validation Systems: The force field was tested on a variety of RNA systems, including tetranucleotides, tetraloops, single-strand RNA, kink-turn, duplex, and a riboswitch [14].
Table 1: Key Parameter Changes in BSFF1 vs. ff99bsc0χOL3 [14]
| Nucleobase Heavy Atom | Force Field | Lennard-Jones ε Parameter (kcal/mol) |
|---|---|---|
| N1(A), N3(C) | ff99bsc0χOL3 | 0.20 |
| BSFF1 | 0.14 | |
| C2(A) | ff99bsc0χOL3 | 0.20 |
| BSFF1 | 0.17 | |
| C4(U) | ff99bsc0χOL3 | 0.20 |
| BSFF1 | 0.15 | |
| O2(C) | ff99bsc0χOL3 | 0.20 |
| BSFF1 | 0.15 |
Assessing Polarizability in RNA-Protein Complexes
A study compared force fields for simulating RNA-protein complexes [16].
- Objective: To determine how polarizable and non-polarizable force fields differ in simulating the dynamics and stability of RNA-protein complexes [16].
- Systems Studied: Three complexes: Argonaute 2 (Ago2), CasPhi-2 (Cas12j), and Retinoic acid-inducible gene I (RIG-I) [16].
- Force Fields Tested:
- Non-polarizable: Amber ff14SB/OL3, ff19SB/OL3, OPLS4.
- Polarizable: AMOEBA.
- Hybrid: ff19SB/OL3 with the polarizable O3P water model [16].
- Key Finding: Non-polarizable force fields tended to produce compact and stable complexes. In contrast, polarizable force fields (AMOEBA) and the hybrid model (with O3P water) allowed significantly more movement, which in some cases led to the disintegration of the complex, especially in proteins with longer loops [16].
Table 2: Force Field Performance in RNA-Protein Complex Simulations [16]
| Force Field Type | Example Force Fields | Complex Stability | Conformational Flexibility | Notes & Recommendations |
|---|---|---|---|---|
| Non-Polarizable | ff19SB/OL3, OPLS4 | High | Lower | Produces compact, stable complexes. A reliable starting point. |
| Fully Polarizable | AMOEBA | Variable (Lower) | Higher | Allows more movement but may destabilize complexes. Monitor structural integrity closely on long timescales. |
| Polarizable Solvent | ff19SB/OL3 with O3P water | Moderate | Moderate | A compromise; improves electrostatic description without the full cost/instability of a polarizable force field. |
Workflow and Relationship Diagrams
Table 3: Key Computational Tools for RNA-Ligand Simulation Research
| Item Name | Type/Category | Primary Function |
|---|---|---|
| AMBER | MD Software Suite | Provides tools (tleap, sander, pmemd) for running simulations with various force fields like ff19SB/OL3. |
| GROMACS | MD Software Suite | A highly optimized package for performing MD simulations, including enhanced sampling methods. |
| OpenFF Toolkit & Evaluator | Force Field Parameterization | A suite for developing and testing force field parameters against physical property data [17]. |
| BICePs | Analysis/Refinement Algorithm | Bayesian inference for refining conformational ensembles and force field parameters against experimental data [18]. |
| PLUMED | Enhanced Sampling Plugin | A library for implementing various enhanced sampling methods, such as metadynamics, in MD simulations. |
| ff99bsc0χOL3 | RNA Force Field | A previously standard RNA force field, often used as a baseline for comparison and development [14]. |
| BSFF1 | RNA Force Field | A base-specifically optimized force field that reduces over-stacking and intercalation artifacts [14]. |
| AMOEBA | Polarizable Force Field | A force field that includes polarizability for a more accurate description of electrostatic interactions [16]. |
Frequently Asked Questions (FAQs)
What is the "Timescale Problem" in molecular simulation? The Timescale Problem, also known as the Sampling Problem, refers to the critical challenge in molecular dynamics (MD) where many processes of interest occur on timescales that are inaccessible to standard simulations due to high computational cost. This happens when high energy barriers separate metastable states, making transitions between them rare events. Consequently, a simulation started in one state may remain trapped there, unable to explore other relevant configurations within a practical simulation time [19].
How does the choice of Force Field impact sampling and validation? The accuracy of force fields significantly influences the reliability of simulation outcomes, including sampling. Force fields are computational models that describe the forces between atoms within molecules or between molecules. Their parameters for calculating potential energy are derived from laboratory experiments, quantum mechanics calculations, or both [20]. Inaccuracies in these parameters, particularly concerning electrostatic interactions and desolvation energies, can lead to incorrect predictions of system behavior. For example, pKa values of protein sidechains calculated from constant pH simulations can be sensitive to the underlying protein force field and water model, potentially leading to errors such as the undersolvation of neutral histidines or overstabilization of salt bridges [21]. Validating force fields against experimental data is therefore essential to ensure they accurately represent the true energy landscape.
What are the most common symptoms of inadequate sampling in my simulation? The most common symptom is the inability to observe transitions between different metastable states of your system. For example, if you are simulating a protein-ligand binding process, you might only see the ligand in the unbound state throughout your entire simulation run, never witnessing the binding event or the reverse dissociation. This indicates your simulation is trapped in one free energy minimum and cannot cross the barrier to other states within the simulated time [19].
My simulation isn't converging. Could poor sampling be the cause? Yes, inadequate sampling is a primary reason for non-convergence in simulations. If your simulation cannot sufficiently explore the configuration space—especially all the relevant low-energy states and the transition paths between them—then computed properties (like free energy differences or average structural properties) will not settle to a stable value. This is often directly linked to the presence of high free energy barriers that the simulation cannot overcome in the allotted time [19] [22].
Troubleshooting Guides
Diagnosis: Is Your Simulation Suffering from the Timescale Problem?
Follow this flowchart to diagnose the core issue. The corresponding Graphviz code is provided for visualization.
Diagram Title: Timescale Problem Diagnosis Flowchart
Solution: Implementing Enhanced Sampling with Metadynamics
This guide provides a step-by-step protocol for setting up a Well-Tempered Metadynamics simulation, a popular enhanced sampling method, using the PLUMED plugin [19].
Diagram Title: Metadynamics Simulation Workflow
Protocol Steps:
- Collective Variables (CVs) Selection: This is the most critical step. Identify a small number of CVs (1-3 is common) that are capable of distinguishing between the metastable states and describing the slow degrees of freedom of the process you want to study. Examples include a key atomic distance for a binding event, a dihedral angle for a conformational change, or a radius of gyration for folding [19].
- Parameters for Bias Potential: Configure the history-dependent bias potential in your input file (e.g., for PLUMED).
- Gaussian Height: The initial energy kick. In Well-Tempered Metadynamics, this decreases over time for smoother convergence [19].
- Gaussian Width: The spread of the Gaussian in CV space. This should be small enough to resolve features but large enough for efficient filling [19].
- Deposition Frequency: How often a Gaussian is added. A higher frequency speeds up exploration but requires careful tuning to avoid artifacts [19].
- System Equilibration: Perform a conventional MD simulation starting from a relevant configuration (e.g., a crystal structure) to equilibrate the system's temperature, pressure, and local structure before applying the bias.
- Production Metadynamics Run: Execute the simulation with the bias potential active. The software will periodically add Gaussian potentials, discouraging the system from revisiting sampled regions and pushing it to explore new ones.
- Free Energy Surface (FES) Calculation: After the simulation, the deposited bias potential can be processed to obtain the underlying FES. PLUMED provides tools to sum the Gaussians, and the FES can be estimated as the negative of the bias potential at convergence [19].
Research Reagent Solutions
Table 1: Essential Software and Computational Tools for Enhanced Sampling
| Item Name | Function/Application | Key Features |
|---|---|---|
| PLUMED [19] | An open-source library for enhanced sampling, free-energy calculations, and analysis of MD simulations. | Works with major MD engines (GROMACS, AMBER, OpenMM); provides a vast suite of methods including Metadynamics; extensive documentation and community. |
| GROMACS [19] | A high-performance MD simulation package. | Extremely fast for biomolecular systems; widely used; fully compatible with PLUMED for enhanced sampling. |
| AMBER [21] | A suite of biomolecular simulation programs. | Includes tools for MD simulations with various force fields; supports constant pH MD and other advanced protocols. |
| OpenMM [20] | A toolkit for molecular simulation using high-performance computing. | High flexibility and GPU optimization; cross-platform; can be used with PLUMED. |
Table 2: Comparison of Common Enhanced Sampling Methods
| Method | Primary Principle | Best For | Key Tuning Parameters |
|---|---|---|---|
| Metadynamics [19] | Fills free energy minima with a history-dependent bias potential to drive transitions. | Exploring unknown free energy surfaces; complex conformational changes. | Collective Variables (CVs), Gaussian height/width/frequency. |
| Well-Tempered Metadynamics [19] | A variant of Metadynamics where the Gaussian height reduces over time. | Achieving converged free energy estimates; systems with complex, rugged landscapes. | CVs, initial Gaussian height, bias factor (tempering). |
| Umbrella Sampling | Restrains the simulation at specific points along a reaction coordinate. | Calculating free energy profiles along a known, one-dimensional reaction coordinate. | Force constant for restraints, spacing of windows. |
| Replica Exchange | Runs multiple simulations in parallel at different temperatures or Hamiltonians and swaps configurations. | Improving sampling of systems with frustrated energy landscapes (e.g., protein folding). | Number of replicas, temperature range or Hamiltonian variants. |
Frequently Asked Questions
What are the main types of uncertainty in molecular simulations? There are two primary types [23]:
- Aleatory Uncertainty: inherent, irreducible randomness in a process or system. It's naturally measured by relative frequency and is attributed to stochastic behavior.
- Epistemic Uncertainty: arises from incomplete knowledge or expertise, such as limitations in the model or force field. It can be reduced by obtaining more information.
How can I tell if my simulation has been sampled adequately? A key step is to estimate the correlation time (τ) of your data [1]. This measures how many steps apart two data points must be before they can be considered statistically independent. If your simulation length is not significantly longer than the correlation time, your sampling is likely inadequate. Use a tiered approach: perform feasibility checks, run your simulation, conduct semi-quantitative checks for sampling quality, and only then calculate observables and uncertainties [1].
What is the difference between accuracy and uncertainty? Accuracy is how close a prediction is to a known value. Uncertainty is a measure of how much predictions and target values can vary [23]. A model can be precise (low uncertainty) but inaccurate if it is consistently wrong, or accurate on average but with high uncertainty in its individual predictions.
Which force field should I use for my protein-ligand binding affinity calculations? There is no single "best" force field, and performance can depend on the specific system. Benchmarking on known data is crucial [24]. For example, in Free Energy Perturbation (FEP) calculations, different combinations of protein forcefields (AMBER ff14SB, ff15ipq), water models (SPC/E, TIP3P, TIP4P-EW), and charge models (AM1-BCC, RESP) have been evaluated, yielding different error metrics [24]. Cross-validation with data not used in parameterization is a recommended best practice [25].
What are some best practices for reporting uncertainties? Always report the standard uncertainty (experimental standard deviation of the mean) for your estimated observables [1]. Clearly state which UQ method was used (e.g., block averaging, bootstrap methods) and ensure your workflow includes checks for adequate sampling. Communicating the assumptions behind your UQ analysis is critical for others to interpret your results correctly [1].
Troubleshooting Guides
Problem: Large Statistical Uncertainty in Results
Symptoms:
- Error bars (standard uncertainty) on your key observables are unacceptably large.
- Results fluctuate significantly between different simulation runs or trajectory segments.
Solutions:
- Extend Simulation Time: The most straightforward solution. The experimental standard deviation of the mean decreases with the square root of the number of uncorrelated samples [1].
- Check for Inefficient Sampling:
- Calculate the integrated correlation time (τ) for your observables [1].
- If τ is large, the data is highly correlated, meaning you have fewer effective independent samples.
- Mitigation: Employ enhanced sampling techniques (e.g., Hamiltonian replica exchange, solute tempering) to overcome energy barriers and decorrelate your data faster [24].
- Use More Efficient UQ Methods: Instead of simply using uncorrelated data points, consider advanced methods like the bootstrap or jackknife resampling, which can provide better uncertainty estimates from correlated data [1].
Problem: Suspected Force Field Inaccuracy
Symptoms:
- Your simulation results consistently deviate from reliable experimental data, even when statistical uncertainties are small.
- The observed systematic error is larger than the estimated statistical uncertainty.
Solutions:
- Benchmark and Validate: Compare your simulation results against a benchmark set of experimental data that was not used in the force field's parameterization [25]. The JACS benchmark set is a common example for protein-ligand binding [24].
- Cross-Validation: Use techniques like k-fold cross-validation or leave-one-out cross-validation to test the force field's predictive performance on data it wasn't trained on [25].
- Systematic Parameter Evaluation: Test different combinations of force fields, water models, and charge assignment methods to identify the most accurate parameter set for your specific system [24].
Uncertainty Quantification Troubleshooting Workflow
Problem: How to Choose a UQ Method
Symptoms:
- Uncertainty in which statistical technique to use for uncertainty quantification.
- Need to balance computational cost with robustness.
Solutions: The table below summarizes common UQ methods.
| Method | Description | Best For | Key Considerations |
|---|---|---|---|
| Block Averaging [1] | Divides data into blocks to estimate variance from correlated data. | Standard MD/MC simulations with time-series data. | A traditional method in molecular simulation. |
| Bootstrap Methods [1] | Resamples data with replacement to build an empirical distribution. | Complex observables, derived quantities. | Computationally intensive but very general. |
| Bayesian Inference [23] | Treats parameters as probability distributions, combining prior knowledge with data. | Incorporating prior information, rigorous uncertainty propagation. | Requires specifying a prior; often uses Markov Chain Monte Carlo (MCMC). |
| Conformal Prediction [23] | Provides distribution-free prediction intervals with coverage guarantees. | Black-box models, regression, and classification tasks. | Model-agnostic and provides strict statistical guarantees. |
| Ensemble Methods [23] | Trains multiple models and quantifies uncertainty from their disagreement. | Machine learning potentials, neural networks. | High computational cost due to multiple training runs. |
The Scientist's Toolkit: Research Reagents & Materials
| Item | Function in Uncertainty Quantification |
|---|---|
| Benchmark Sets (e.g., JACS set) [24] | Standardized collections of molecules and properties to consistently evaluate and validate force field accuracy against experimental data. |
| Enhanced Sampling Algorithms (e.g., REST) [24] | Techniques like Replica Exchange with Solute Tempering (REST) enhance conformational sampling, reducing correlation times and improving statistical reliability. |
| Cross-Validation Protocols [25] | Statistical methods like k-fold cross-validation that assess how a model will generalize to an independent dataset, crucial for testing predictive power. |
| Correlation Time Analysis [1] | A diagnostic tool to determine the number of simulation steps between statistically independent samples, which is fundamental for calculating correct uncertainties. |
| Open-Source MD Packages (e.g., OpenMM) [24] | Software that enables reproducible and automated simulation workflows, allowing for systematic testing of different force fields and parameters. |
Advanced Sampling Methods and Force Field Selection Protocols
FAQs and Troubleshooting Guides
Gaussian Accelerated Molecular Dynamics (GaMD)
Q: How does GaMD improve sampling efficiency, and when should I use it? A: GaMD applies a harmonic boost potential to the system's potential energy, which smooths the energy landscape and reduces energy barriers. This allows the system to transition more easily between conformational states, accelerating the sampling of rare events like ligand binding and protein folding. You should use GaMD when studying complex biomolecular processes that occur on timescales beyond what conventional MD can access, particularly when you lack predefined reaction coordinates. GaMD has been successfully applied to study protein-ligand binding mechanisms, such as in investigations of DPP4 inhibitors for diabetes treatment [26].
Q: My GaMD simulations are not converging. What could be wrong? A: Convergence issues in GaMD can stem from several factors:
- Insufficient simulation time: Despite enhanced sampling, GaMD still requires adequate time to explore the conformational space. Ensure your simulation length is appropriate for the biological process.
- Suboptimal boost potential: The applied boost potential must be properly calibrated. If too low, barriers remain; if too high, it can distort the energy landscape. Verify that your boost parameters follow the principles described in GaMD methodologies [27] [26].
- System preparation issues: As with any MD simulation, issues can arise from improper system setup, including incorrect protonation states, missing residues, or inappropriate water box size.
Q: What is the difference between GaMD and LiGaMD? A: LiGaMD (Ligand Gaussian accelerated Molecular Dynamics) is an extension of GaMD specifically designed to enhance sampling of ligand binding and dissociation events. While standard GaMD applies a boost to the entire system potential, LiGaMD selectively enhances the potential energy associated with ligand degrees of freedom, making it particularly effective for studying protein-ligand interactions and calculating binding free energies and kinetics [26].
Replica-Exchange Molecular Dynamics (REMD)
Q: How do I determine the optimal number and temperature distribution of replicas? A: The number and temperature spacing of replicas are critical for achieving adequate exchange rates between neighboring replicas. According to GROMACS documentation, for a system with N atoms, the temperature spacing should approximately follow ε ≈ 1/√N to maintain a good exchange probability (around 0.135). GROMACS provides an online REMD calculator to help determine appropriate temperature distributions based on your system size and desired temperature range [28].
Q: My REMD simulation shows low exchange rates between replicas. How can I improve this? A: Low exchange rates typically indicate that your temperature spacing is too wide. Try:
- Increasing the number of replicas to reduce the temperature difference between neighbors.
- Adjusting the temperature range to ensure better overlap in potential energy distributions.
- Considering Hamiltonian REMD (H-REMD) methods like REST2, which scale solute-solvent interactions and can be more efficient for biomolecular systems [29] [30].
Q: What is the difference between T-REMD and REST2? A: Temperature REMD (T-REMD) runs replicas at different temperatures, attempting exchanges based on the Metropolis criterion. REST2 (Replica Exchange with Solute Tempering) is a Hamiltonian-based approach where instead of heating the entire system, primarily the solute degrees of freedom are "heated" by scaling the solute-solute and solute-solvent interactions. REST2 is often more efficient for biomolecular systems as it reduces the number of replicas needed by focusing the enhanced sampling on the region of interest [29].
Alchemical Free Energy Methods
Q: How do I choose between FEP and TI for my free energy calculations? A: Both FEP (Free Energy Perturbation) and TI (Thermodynamic Integration) are rigorous methods for calculating relative binding free energies. FEP computes free energy differences as the summation of transformations between fixed λ states, while TI numerically integrates the derivative of the Hamiltonian with respect to λ. The choice often depends on your specific system and software implementation. Recent studies using automated FEP workflows with OpenMM have shown that FEP can achieve mean unsigned errors around 0.8-1.0 kcal/mol for protein-ligand binding affinity predictions, making it suitable for drug discovery applications [24].
Q: My alchemical transformations show poor overlap between adjacent λ states. What should I do? A: Poor overlap between λ states is a common issue that can lead to inaccurate free energy estimates. Consider these solutions:
- Increase the number of intermediate λ states to create smaller transitions between states.
- Implement Hamiltonian replica exchange between λ states (λ-REMD) to improve sampling across the alchemical pathway.
- Extend simulation time for each λ window to ensure better equilibration and sampling.
- Check your force field parameters, as inaccurate parameters can exacerbate overlap issues [24].
Q: How does force field choice impact alchemical free energy calculations? A: Force field selection significantly impacts the accuracy of free energy calculations. Studies comparing AMBER ff14SB and ff15ipq force fields with different water models (SPC/E, TIP3P, TIP4P-EW) have shown that prediction errors can vary by 0.1-0.2 kcal/mol depending on the combination. For example, using AMBER ff14SB with TIP3P water and AM1-BCC charges achieved an MUE of 0.82 kcal/mol in binding affinity predictions, while RESP charges with the same force field increased the error to 1.03 kcal/mol [24].
Quantitative Data Tables
Table 1: Performance Comparison of Free Energy Methods and Force Fields
| Method | Force Field | Water Model | Charge Model | MUE (kcal/mol) | RMSE (kcal/mol) | R² |
|---|---|---|---|---|---|---|
| FEP+ [24] | OPLS2.1 | - | CM1A-BCC | 0.77 | 0.93 | 0.66 |
| AMBER TI [24] | AMBER ff14SB | SPC/E | RESP | 1.01 | 1.3 | 0.44 |
| Alchaware [24] | AMBER ff14SB | SPC/E | AM1-BCC | 0.89 | 1.15 | 0.53 |
| Alchaware [24] | AMBER ff14SB | TIP3P | AM1-BCC | 0.82 | 1.06 | 0.57 |
| Alchaware [24] | AMBER ff14SB | TIP4P-EW | AM1-BCC | 0.85 | 1.11 | 0.56 |
| Alchaware [24] | AMBER ff15ipq | SPC/E | AM1-BCC | 0.85 | 1.07 | 0.58 |
| Alchaware [24] | AMBER ff14SB | TIP3P | RESP | 1.03 | 1.32 | 0.45 |
Table 2: Comparison of Enhanced Sampling Techniques for RNA Tetraloop Folding
| Method | System | Sampling Efficiency | Convergence Time | Key Findings |
|---|---|---|---|---|
| REST2 [30] | RNA GAGA TL | Low | No convergence after 120 μs/replica | Inadequate alone for complex folding |
| REST2 [30] | RNA UUCG TL | Low | No convergence after 120 μs/replica | Limited barrier crossing |
| REST2 + WT-MetaD [30] | RNA GAGA TL | High | 5-10 μs/replica | 100x improvement over REST2 alone |
| T-REMD [29] | RNA Tetraloops | Moderate | Varies with system | Better than standard MD but slow |
| WT-MetaD [29] | RNA Tetraloops | High | Depends on CV choice | Requires careful CV selection |
Table 3: GaMD Applications in Drug Discovery Studies
| Application | System | Method Variant | Key Outcomes |
|---|---|---|---|
| DPP4 Inhibitor Screening [26] | DPP4-FDA drug complexes | GaMD/LiGaMD | Revealed binding/unbinding mechanisms correlated with IC50 |
| Protein-Ligand Binding [27] | CD2-CD58 (168,000 atoms) | GaMD-US/dual-water | PMF converged within 1 kcal/mol of experimental value |
| Large Biological Systems [27] | Polarizable FF simulations | Multi-level GaMD | Reduced time to convergence by 10-20x compared to US |
Experimental Protocols
Protocol: GaMD Simulation Setup for Protein-Ligand Binding
Objective: Study binding mechanisms of DPP4 inhibitors using GaMD [26].
Step-by-Step Methodology:
- System Preparation:
- Obtain crystal structure of DPP4 with bound ligand (if available)
- Parameterize ligands using appropriate tools (GAFF2, CGenFF, etc.)
- Solvate system in TIP3P water box with 10-12 Å buffer
- Add ions to neutralize system and achieve physiological concentration (0.15 M NaCl)
Conventional MD Equilibration:
- Minimize energy using steepest descent (5,000 steps)
- Heat system gradually from 0 to 300 K over 100 ps with position restraints on heavy atoms
- Equilibrate without restraints for 50-100 ns until system stabilizes
- Monitor RMSD, potential energy, and temperature for stability
GaMD Enhancement:
- Calculate potential statistics (average, standard deviation, maximum, minimum) from conventional MD
- Set boost potential parameters according to GaMD theory:
- Lower bound for boosting: σ₀P ≈ 1.0 kcal/mol
- Upper bound for boosting: ensure maximum boost potential respects theory
- Apply harmonic boost to dihedral potential energy terms
- Run dual-boost GaMD for enhanced sampling of both torsional and total potential energies
Production Simulation:
- Run GaMD production for 500 ns - 1 μs depending on system size
- Save frames every 100 ps for analysis
- Monitor boost potential to ensure it remains within theoretical bounds
Analysis:
- Identify binding poses using clustering analysis
- Calculate binding free energy profiles using the GaMD reweighting algorithm
- Identify key residues involved in binding through interaction analysis
Protocol: REST2 Simulations for RNA Folding
Objective: Enhance sampling of RNA tetraloop folding using REST2 [29] [30].
Step-by-Step Methodology:
- System Preparation:
- Build RNA tetraloop structure (e.g., 5'-GAGA-3' or 5'-UUCG-3')
- Use appropriate RNA force field (e.g., AMBER OL3 with bsc0 and χOL3 modifications)
- Solvate in water box with 10 Å minimum padding
- Add ions (Na⁺, Cl⁻) to neutralize and achieve desired ionic concentration
Replica Setup:
- Determine number of replicas (typically 12-16 for small RNA systems)
- Set up temperature or Hamiltonian scaling factors using geometric progression
- For REST2, define solute atoms (RNA and essential ions) for scaling
- Set exchange attempt frequency (every 1-2 ps)
Simulation Parameters:
- Use PME for electrostatic calculations with 8-10 Å cutoff
- Constrain bonds involving hydrogen with SHAKE or LINCS
- Set integration time step of 2 fs
- Maintain temperature with Langevin dynamics
- Use isotropic pressure coupling for equilibration
Production Run:
- Run each replica for 100-500 ns depending on system complexity
- Monitor exchange rates (target: 20-30% between neighboring replicas)
- Check for replica diffusion through temperature space
Analysis:
- Calculate free energy surfaces using weighted histogram analysis method (WHAM)
- Identify folded and unfolded states using collective variables (RMSD, hydrogen bonds)
- Compute folding free energies (ΔGfold°) from population distributions
- Assess convergence by comparing forward and reverse halves of the simulation
Protocol: Alchemical FEP for Relative Binding Affinities
Objective: Calculate relative binding free energies for congeneric ligands using FEP [24].
Step-by-Step Methodology:
- System Preparation:
- Prepare protein structure with co-crystallized ligand
- Generate ligand structures for transformation series
- Parameterize ligands using GAFF2 with AM1-BCC or RESP charges
- Align ligands for minimal perturbation during transformation
Topology Setup:
- Create dual-topology or hybrid-topology approach for transformation
- Define λ schedule (typically 12-16 windows with closer spacing near endpoints)
- Set up soft-core potentials for van der Waals interactions
Equilibration:
- Minimize each λ window separately
- Heat gradually to 300 K with restraints on protein and ligand heavy atoms
- Equilibrate without restraints for 2-5 ns per window
- Monitor volume and density for stability
Production Simulation:
- Run each λ window for 10-50 ns depending on system complexity
- Implement Hamiltonian exchange between λ windows (λ-REMD) every 1-2 ps
- Use Monte Carlo barostat for constant pressure
- Save energies frequently for overlap analysis
Analysis:
- Calculate free energy differences using MBAR or Bennett Acceptance Ratio
- Check for sufficient overlap between adjacent λ windows
- Estimate statistical uncertainty using block analysis or bootstrapping
- Validate with cycle closures in transformation maps
Visualization Diagrams
GaMD Workflow
REMD Exchange Mechanism
Alchemical Free Energy Pathway
The Scientist's Toolkit: Research Reagent Solutions
Table 4: Essential Software Tools for Enhanced Sampling Simulations
| Tool Name | Type | Primary Function | Application Examples |
|---|---|---|---|
| OpenMM [24] | MD Engine | High-performance MD simulations | FEP calculations, GPU-accelerated sampling |
| Tinker-HP [27] | MD Package | Polarizable force field simulations | GaMD with AMOEBA force field |
| Alchaware [24] | FEP Workflow | Automated free energy calculations | Relative binding affinity predictions |
| GROMACS [28] | MD Engine | REMD simulations | Temperature and Hamiltonian replica exchange |
| pymd [26] | Analysis Toolkit | Protein-compound binding analysis | GaMD/LiGaMD trajectory analysis |
| AMBER [29] | MD Suite | Nucleic acid simulations | RNA folding with OL3 force field |
Table 5: Force Fields and Parameter Sets
| Force Field | Best For | Key Features | Recommended Usage |
|---|---|---|---|
| AMBER ff14SB [24] | Protein simulations | Optimized for standard proteins | General protein-ligand systems |
| AMBER ff15ipq [24] | High-accuracy proteins | Implicitly polarized charges | Systems requiring high accuracy |
| AMOEBA [27] | Polarizable simulations | Polarizable multipole electrostatics | Systems with strong polarization effects |
| AMBER OL3 [29] [30] | RNA simulations | bsc0 and χOL3 modifications | RNA folding and dynamics |
| GAFF2 [24] | Small molecules | General Amber Force Field | Ligand parameterization |
| OPLS2.1 [24] | Drug discovery | Optimized for binding affinity | Protein-ligand binding FEP |
Table 6: Specialized Sampling Methods
| Method | Best Application | Key Advantage | Implementation Tips |
|---|---|---|---|
| GaMD [27] [26] | Biomolecular dynamics | No predefined CVs needed | Use dual-boost for comprehensive sampling |
| LiGaMD [26] | Protein-ligand binding | Selective ligand enhancement | Ideal for binding kinetics |
| REST2 [29] [30] | Biomolecular folding | Reduced replica count | Define solute region carefully |
| WT-MetaD [29] [30] | Defined reaction pathways | Fast convergence with good CVs | Combine with REST2 for best results |
| FEP/λ-REMD [24] | Relative binding affinities | Alchemical transformations | Use closely spaced λ windows |
Frequently Asked Questions (FAQs)
Q1: What are the main advantages of using deep learning over traditional Molecular Dynamics (MD) for sampling conformational ensembles?
Deep learning (DL) offers several key advantages for sampling conformational ensembles, particularly for complex systems like Intrinsically Disordered Proteins (IDPs) [31]:
- Efficiency and Speed: DL models can generate statistically independent samples in seconds or minutes, bypassing the femtosecond-level integration steps of MD that require GPU-days to simulate millisecond-level transitions [32].
- Overcoming Sampling Limitations: DL models excel at capturing rare, transient states that are biologically relevant but often missed by MD due to vast timescale separations [31].
- Direct Ensemble Emulation: Generative models, such as diffusion models, can directly learn and sample the equilibrium distribution of conformations from data, providing a more end-to-end paradigm for exploring conformational landscapes [32].
Q2: My MD simulations struggle to adequately sample the diverse states of an IDP. Which AI method should I consider?
For IDPs, a promising approach is to use transferable generative models that leverage pre-trained protein folding networks. These models use architectural elements from systems like AlphaFold2, conditioned on multiple sequence alignments (MSAs), to produce a diverse distribution of structures [32]. This approach has been shown to improve the recall of conformational states observed in longer simulations and can generate ensembles with comparable accuracy to MD but greater diversity [32] [31].
Q3: How can I validate a deep learning-generated conformational ensemble to ensure it is physically realistic?
Validation should involve multiple complementary techniques [32] [25]:
- Comparison with Experimental Data: Validate against experimental ensemble-averaged data such as NMR chemical shifts, Residual Dipolar Couplings (RDCs), and Small-Angle X-Ray Scattering (SAXS) profiles [31].
- Recovery of Known States: Check if the generated ensemble recovers known conformational states from the PDB or from long-reference MD simulations [32].
- Physical Property Calculation: Compute properties like root mean square fluctuation (RMSF) profiles, contact fluctuations, and solvent accessibilities, and compare them with those derived from MD simulations or physical expectations [32] [33].
- Kinetic and Thermodynamic Consistency: For methods involving coarse-grained ML potentials, the resulting simulations can be validated using standard physical checks, such as ensuring the kinetic energy follows a Maxwell-Boltzmann distribution [33].
Q4: What are the common failure modes when using constrained conformational sampling with AI-enhanced tools, and how can I troubleshoot them?
A common issue, as seen with tools like CREST, is the early termination of sampling or program crashes during the optimization of generated ensembles [34]. This can be due to several factors:
- Overly Restrictive Constraints: Applying too many or overly strong harmonic constraints can destabilize the sampling algorithm. Troubleshooting: Review the force constants and the number of constrained atoms; try a less restrictive setup.
- System Size and Complexity: Large cluster models (e.g., 200-400 atoms) push the limits of sampling algorithms. Troubleshooting: If possible, break down the problem or use a simpler model to first verify the sampling parameters.
- Software-Specific Bugs: The error "free(): invalid next size (fast)" indicates a potential memory management issue within the code itself [34]. Troubleshooting: Ensure you are using the latest stable version of the software and check issue trackers for known bugs and patches.
Troubleshooting Guides
Issue 1: Generated Conformational Ensemble Lacks Diversity
Problem: The AI model produces a very narrow set of conformations, failing to capture the known heterogeneity of the protein.
| Possible Cause | Diagnostic Steps | Solution |
|---|---|---|
| Insufficient or Biased Training Data | Check the diversity of the training set (e.g., PDB structures, MD trajectories). Is your system underrepresented? | Fine-tune a pre-trained model on diverse, system-specific MD data [32]. |
| Over-regularization or Poor Model Calibration | Monitor the training and validation loss curves. A high validation loss suggests poor generalization [35]. | Reduce regularization strength (e.g., L2 penalty, dropout) and ensure the model is not overfitting [35]. |
| Incorrect Sampling Parameters | Analyze the latent space or sampling noise parameters of the generative model. | Adjust the sampling temperature or noise schedules to explore a wider region of the conformational landscape. |
Issue 2: AI-Generated Ensembles Are Thermodynamically Implausible
Problem: The generated structures have high steric clashes, unrealistic torsion angles, or do not correspond to low-energy states.
| Possible Cause | Diagnostic Steps | Solution |
|---|---|---|
| Decoupling from Physical Potentials | The purely data-driven model has learned correlations that violate physical laws. | Use a hybrid approach: Employ a generative model for initial sampling, then refine structures with a short MD relaxation using a physical or machine learning force field [31]. |
| Poorly Validated Force Field | If using an ML potential, it may be inaccurate for your specific system. | Rigorously validate the force field by checking properties like energy conservation in NVE simulations or kinetic energy distributions in NVT simulations [33] [36]. |
| Lack of Energetic Ranking | The model generates structures but does not provide their relative energies. | Integrate a re-ranking step. Generate a diverse ensemble with the AI, then compute the relative energies of the conformers using a higher-level theory like DFT or a validated force field to obtain a Boltzmann-weighted ensemble [37]. |
Issue 3: High Computational Cost of Refining AI-Generated Ensembles
Problem: Using high-level quantum mechanics (QM) methods to reoptimize and re-rank thousands of AI-generated conformers is prohibitively expensive.
Solution: Implement a multi-level workflow to reduce computational cost while maintaining accuracy, as demonstrated for molecular dimers [37]. The following workflow diagram illustrates this efficient, multi-step process:
Workflow Description:
- Initial Sampling: Use an efficient tool like CREST with a fast semi-empirical method (GFN2-xTB) to generate a broad, initial set of conformers [37].
- Intermediate Reoptimization: Reoptimize the entire initial ensemble using a low-cost but accurate composite quantum chemistry method (e.g., B97-3c). This step corrects major geometric and energetic errors from the initial sampling without the cost of full DFT [37].
- Deduplication: Remove duplicate conformers that coalesce after the intermediate reoptimization. This can eliminate a large percentage (~90%) of structures, drastically reducing the number that proceed to expensive DFT [37].
- High-Level Refinement: Perform a final reoptimization and vibrational frequency calculation on the remaining unique conformers using a higher-level DFT method.
- Final Energetics: Compute ultra-accurate single-point energies for the final conformers using an even higher level of theory (e.g., ωB97X-V/def2-QZVPP) to obtain precise relative energies for Boltzmann weighting [37].
This table details essential computational tools and datasets for AI-driven conformational ensemble generation.
| Resource Name | Type | Function & Application |
|---|---|---|
| CREST | Software | A Conformer-Rotamer Ensemble Sampling Tool that uses metadynamics with GFN2-xTB to extensively explore conformational space for molecules and non-covalent complexes [37]. |
| mdCATH & ATLAS | Dataset | Large-scale, publicly available Molecular Dynamics datasets providing thousands of microseconds of simulation data for training and validating generative models on folded proteins [32]. |
| AlphaFlow, UFConf, DiG | AI Model | Examples of transferable generative models (diffusion models) that use MSA-based conditioning from AlphaFold2 to generate diverse conformational ensembles from a single sequence or structure [32]. |
| Martini3-IDP | Force Field | A specialized coarse-grained force field parameterized for Intrinsically Disordered Proteins, useful for running long simulations or as a target for ML potentials focused on IDPs [38]. |
| B97-3c / ωB97X-3c | Quantum Chemistry Method | Computationally efficient composite density functional theory methods ideal for intermediate reoptimization and re-ranking of large conformational ensembles [37]. |
| GROMACS Physical Validation Module | Validation Suite | A suite of tests integrated into the GROMACS MD package to check simulation results against physical expectations, such as integrator convergence and correct ensemble sampling [33]. |
Systematic Force Field Comparison Across Biological Systems
This technical support center provides troubleshooting guides and FAQs to help researchers navigate force field selection and address common challenges in molecular dynamics simulations, framed within the context of handling sampling limitations in force field validation research.
Frequently Asked Questions
FAQ 1: How does force field choice impact the prediction of key biophysical properties like pKa values? The accuracy of pKa value predictions in constant pH molecular dynamics simulations is highly sensitive to the underlying force field. Different force fields exhibit systematic errors due to variations in how they handle electrostatic interactions and desolvation energies [39]. For example, simulations of the mini-protein BBL showed that both Amber ff19sb/OPC and ff14sb/TIP3P combinations produced significant errors for buried histidines and glutamic acids involved in salt bridges, with errors manifesting as overestimated pKa downshifts [39]. These errors arise from fundamental force field limitations: undersolvation of neutral histidines and overstabilization of salt-bridge interactions [39].
FAQ 2: Which force fields show the best agreement with NMR data for protein simulations? Systematic comparisons against NMR experimental data reveal distinct performance tiers among popular force fields. Based on 10-microsecond simulations of ubiquitin and Protein G, force fields can be categorized into three performance classes [40]:
- Good agreement: CHARMM22, CHARMM27, Amber ff99SB-ILDN, and Amber ff99SB-ILDN
- Intermediate agreement: Amber ff03 and Amber ff03*
- Lower agreement: OPLS and CHARMM22, which showed substantial conformational drift [40] Despite parameter differences, some force fields with substantially different helical preferences can produce surprisingly similar structural ensembles in simulations of stable, folded proteins [40].
FAQ 3: What are the key considerations when selecting a DNA force field? For DNA simulations, the choice between AMBER (bsc1, OL15) and CHARMM36 force fields involves trade-offs in structural accuracy versus elastic property prediction [41]. Recent systematic comparisons show:
- AMBER modifications can be ranked as bsc0 < bsc1 < OL15 for predicted stretch modulus, with bsc0 most flexible and OL15 stiffest [41]
- bsc1 may represent the preferred balance for flexibility studies due to its robust performance across sequence contexts [41]
- All modern DNA force fields show reasonable agreement with experimental elastic constants, but sequence-dependent variations exist [41]
FAQ 4: Which force field performs best for non-natural peptides like β-peptides? For β-peptides and other peptidomimetics, a comprehensive comparison revealed that a recently developed CHARMM extension outperformed Amber and GROMOS alternatives [42]. The CHARMM force field correctly reproduced experimental structures in all monomeric simulations and accurately described oligomeric examples, while Amber and GROMOS could only treat some of the seven tested peptides without further parametrization [42]. This performance advantage stems from the CHARMM extension's torsional energy path matching against quantum-chemical calculations [42].
Troubleshooting Guides
Problem 1: Inaccurate pKa Predictions for Buried Residues
Symptoms: Calculated pKa values for buried histidines or salt-bridge involved glutamic acids show larger-than-expected downshifts compared to experimental values [39].
Solutions:
- Consider using the Amber ff19sb force field with OPC water instead of ff14sb with TIP3P, as studies show significantly improved accuracy with this combination [39].
- Implement atom-pair specific Lennard-Jones corrections (NBFIX) to partially alleviate salt-bridge related pKa errors [39].
- For constant pH simulations, ensure adequate sampling through replica-exchange protocols (e.g., 16 pH replicas with 0.5 unit increments) [39].
Validation Protocol:
Problem 2: Force Field Selection for Novel Biomolecular Systems
Symptoms: Poor agreement with experimental data when simulating non-standard biomolecules like β-peptides or modified nucleic acids.
Solutions:
- For β-peptides, utilize the specialized CHARMM force field extension with parameters derived from quantum-chemical matching [42].
- When simulating DNA elastic properties, select bsc1 for balanced performance across sequence contexts, especially if studying mechanical properties [41].
- For folded protein simulations, prioritize force fields in the "good agreement" category with NMR data (CHARMM22*, CHARMM27, Amber ff99SB-ILDN) [40].
Validation Workflow:
Problem 3: Sampling Limitations in Force Field Validation
Symptoms: Inconclusive results when comparing force fields due to insufficient sampling of conformational space.
Solutions:
- Implement enhanced sampling techniques like replica exchange or metadynamics to improve phase space coverage [43].
- Perform Principal Component Analysis (PCA) to compare essential subspaces sampled by different force fields [40].
- Calculate Root Mean Square Inner Product (RMSIP) between simulation halves to assess convergence and distinguish true force field differences from sampling artifacts [40].
Key Considerations Table:
| Sampling Challenge | Impact on Validation | Mitigation Strategy |
|---|---|---|
| Limited simulation time | May miss rare events or slow dynamics | Use enhanced sampling methods [43] |
| Inadequate replica coverage | Poor pKa convergence | Implement pH replica-exchange with sufficient replicas [39] |
| Essential subspace mismatch | Different force fields sample distinct conformations | Compare RMSIP values between force fields [40] |
Quantitative Force Field Performance Data
| Performance Tier | Force Fields | Key Characteristics |
|---|---|---|
| Good Agreement | CHARMM22, CHARMM27, Amber ff99SB-ILDN, Amber ff99SB-ILDN | Reasonable agreement with NMR data; minimal conformational drift |
| Intermediate Agreement | Amber ff03, Amber ff03* | Distinct structural ensembles but moderate experimental agreement |
| Lower Agreement | OPLS, CHARMM22 | Substantial conformational drift; eventual unfolding observed in GB3 |
| Force Field | Stretch Modulus Trend | Twist Modulus | Best Application Context |
|---|---|---|---|
| bsc0 | Most flexible | Good agreement with experiments | Historical comparisons |
| bsc1 | Intermediate | Excellent structural accuracy | Balanced flexibility studies |
| OL15 | Stiffest | Improved helical twist prediction | Structural accuracy priority |
| CHARMM36 | Similar to AMBER variants | Solid structural predictions | Alternative to AMBER family |
| Biomolecular System | Recommended Force Field | Performance Notes |
|---|---|---|
| β-peptides | CHARMM (custom extension) | Accurate reproduction of experimental structures in all test cases |
| Cyclic β-amino acids | Amber (AMBER*C variant) | Good performance for specific cyclic residues |
| General β-peptides | GROMOS | Limited performance; requires further parametrization |
Experimental Protocols
System Preparation:
- Retrieve protein coordinates from PDB and prepare termini (acetylation/amidation)
- Build hydrogen positions using HBUILD or equivalent
- Add dummy hydrogens to syn positions of carboxylate oxygens on Asp and Glu
- Solvate in truncated octahedral water box with 15 Å minimum distance to protein
- Neutralize system and add ions to achieve 150 mM ionic strength
Simulation Parameters:
- Software: Amber2024 pmemd.cuda engine
- Minimization: 10,000 steps (1,000 steepest descent + 9,000 conjugate gradient)
- Heating: 1 ns from 100K to 300K in NVT ensemble
- Equilibration: Multi-stage NPT ensemble with reducing restraints
- Production: 32 ns per replica with asynchronous pH replica-exchange
Trajectory Analysis Workflow:
- Perform PCA on mass-weighted covariance matrix of atomic positional fluctuations
- Calculate essential subspaces from combined trajectories of all force fields
- Compute Root Mean Square Inner Product (RMSIP) between different simulations
- Normalize RMSIP scores to account for sampling differences within simulations
- Compare structural ensembles in reduced PC subspace to identify force field-specific sampling
The Scientist's Toolkit: Research Reagent Solutions
| Research Reagent | Function in Force Field Studies |
|---|---|
| AMBER Family (ff19sb, ff14sb) | Protein simulations with specific water model preferences [39] |
| CHARMM Family (c22/CMAP, c36, c36m) | Alternative protein parameterization philosophy [39] [40] |
| BSC1/OL15 DNA Modifications | Improved DNA helical parameters and elastic properties [41] |
| TIP3P/OPC Water Models | Solvation properties significantly impact force field performance [39] |
| GROMOS 54A7/54A8 | Specialized support for β-peptides and non-natural amino acids [42] |
| NBFIX Corrections | Atom-pair specific Lennard-Jones parameter adjustments [39] |
Frequently Asked Questions (FAQs)
Q1: My force field fails to reproduce experimental liquid densities and heats of vaporization. What could be wrong with my QM-to-MM parameter derivation? A primary cause is often suboptimal choices in the QM-to-MM mapping protocol. A systematic study testing 15 different protocols found that the best-performing model achieved mean unsigned errors of just 0.031 g cm⁻³ in density and 0.69 kcal mol⁻¹ in heat of vaporization. Key factors to check include [44]:
- Underlying QM Method and Basis Set: The accuracy of the initial electron density calculation is critical.
- Atoms-in-Molecule Partitioning Method: The choice of method (e.g., DDEC, MBIS) for dividing the electron density among atoms directly impacts derived parameters.
- Implicit Solvent Model: Using pre-polarized charges for the condensed phase is often necessary for accuracy.
- Lennard-Jones Parameter Mapping: The protocol for deriving repulsive and dispersion terms from atomic electron densities must be validated.
Q2: Why does my force field consistently misrepresent the solvation of molecules with specific functional groups like amines or nitro-groups? This indicates a potential limitation in the transferability of the non-bonded parameters for those chemical groups. Analyses of generalized force fields have linked systematic errors in hydration free energies (HFE) to specific functionalities [45]:
- Molecules with amine-groups are often under-solubilized (HFEs are too positive).
- Molecules with nitro-groups can be either over- or under-solubilized, depending on the force field.
- Molecules with carboxyl groups are often over-solubilized (HFEs are too negative). These errors stem from how the force field's Lennard-Jones and charge parameters balance interactions with water. Using QM-to-MM mapping to derive bespoke, system-specific non-bonded parameters can help overcome these transferability issues [44].
Q3: What are the most efficient optimization strategies for force field parameterization? The choice of optimization algorithm depends on your goal. A comparative study found that the performance of different methods can vary when fitting to ab initio data versus a test set with a known parameter ground truth [46]. The evaluated methods include:
- Multi-start local optimizers: Simplex, Levenberg-Marquardt, and POUNDERS.
- Global optimizers: Single-Objective and Multi-Objective Genetic Algorithms (GAs). For complex parameter landscapes, global optimization methods like Genetic Algorithms can be more effective in finding a robust parameter set, though they may require more computational resources.
Q4: I am getting "Residue not found in topology database" and "Atom not found in rtp entry" errors in GROMACS. How can I fix this?
These are common errors when using pdb2gmx for molecules not predefined in the force field's residue topology database ( [47]).
- Cause: The force field you selected does not have an entry for the residue or molecule in your coordinate file. The atom names in your file may also not match those expected by the database entry.
- Solutions:
- Use the
-ignhflag to letpdb2gmxignore the existing hydrogens and add the correct ones itself. - For small molecules, you cannot use
pdb2gmxdirectly. You must generate a topology using other tools (e.g., QUBEKit, ffTK, ParamChem) and include it manually in your system topology [44] [48]. - Ensure terminal residues in proteins are correctly named (e.g., N-terminal alanine should be
NALAin AMBER force fields).
- Use the
Experimental Protocols
Protocol 1: Deriving a Bespoke Force Field Using the QUBEKit Workflow
This protocol outlines the steps for generating system-specific force field parameters directly from quantum mechanical calculations using QUBEKit, significantly reducing the number of empirical parameters that need fitting [44].
Objective: To create a force field for a small organic molecule that accurately reproduces its liquid properties. Software: QUBEKit (https://github.com/qubekit/QUBEKit). Optionally uses Gaussian and Chargemol for QM calculations.
Methodology:
- Input Preparation: Provide a 3D molecular structure file.
- Quantum Mechanical Calculation: Perform a QM calculation (e.g., DFT) to obtain the electron density and Hessian matrix.
- Atoms-in-Molecules Analysis: Partition the electron density using a method like DDEC or MBIS to get atomic charges, volumes, and dispersion coefficients.
- Parameter Derivation:
- Bonds & Angles: Derive force constants from the QM Hessian matrix using the modified Seminario method.
- Partial Charges: Assign using the partitioned electron density (e.g., DDEC).
- Lennard-Jones: Map atomic volumes and densities to
rmin/sigmaandepsilonparameters. - Torsions: Fit dihedral parameters to a QM potential energy surface scan.
- Validation: The derived force field is validated by running a molecular dynamics simulation of the pure liquid and comparing the calculated density and heat of vaporization against experimental data.
The workflow for this protocol is summarized in the following diagram:
Protocol 2: Bayesian Refinement of Lennard-Jones Parameters Using Surrogate Models
This protocol uses Bayesian inference and surrogate modeling to efficiently optimize Lennard-Jones parameters against experimental physical properties, a method useful for addressing errors identified in FAQ #2 [17].
Objective: To refine the Lennard-Jones parameters for a specific atom type (e.g., tetravalent carbon) to match experimental mixture density. Software: OpenFF Evaluator, GPytorch, Pyro.
Methodology:
- Design of Experiments: Use Latin Hypercube Sampling (LHS) to generate a set of parameter perturbations (e.g., 90-110% of original
epsilonandrmin_halfvalues). - High-Throughput Simulation: For each parameter set, use the OpenFF Evaluator to automatically run molecular dynamics simulations and compute the target physical property (e.g., density of a pentane/hexane mixture).
- Build a Surrogate Model: Train a Gaussian Process (GP) regression model using the parameter sets as inputs and the simulated densities as outputs. This creates a fast-to-evaluate approximation of the simulation.
- Bayesian Sampling: Use Markov Chain Monte Carlo (MCMC) sampling (e.g., the NUTS sampler) on the GP surrogate to explore the Bayesian posterior distribution of the parameters. This distribution identifies parameter sets that are most consistent with the prior knowledge and the experimental data.
- Model Validation: Select the optimal parameter set from the posterior distribution and validate it with a final, full simulation.
Research Reagent Solutions
The following table lists key software tools and their functions for developing and validating force fields via QM-to-MM mapping.
| Tool Name | Primary Function | Key Feature / Use Case |
|---|---|---|
| QUBEKit [44] | Automated derivation of bespoke force fields | Implements the QM-to-MM mapping workflow; derives bonds, angles, charges, and LJ parameters from QM data. |
| ForceBalance [44] | Systematic parameter optimization | Fits a small number of mapping parameters against experimental liquid data to optimize the entire protocol. |
| Force Field Toolkit (ffTK) [48] | Plugin for ligand parameterization | Provides a GUI workflow for deriving CHARMM-compatible parameters, including charge fitting and torsion scans. |
| OpenFF Evaluator [17] | Automated property calculation | High-throughput simulation of physical properties (density, HFE) for force field training and validation. |
| CP2K [49] | Quantum chemistry software | Performs QM calculations (DFT) to generate target data (electron densities, Hessians) for QM-to-MM mapping. |
| ParamChem [48] | Automated parameter assignment | Provides initial atom typing and parameters by analogy to the CGenFF force field, useful as a starting point. |
Protocol Design for Efficient Binding Affinity Calculations
Calculating binding affinity is a critical step in drug discovery and biochemical research. However, the accuracy of these calculations is often compromised by two interconnected challenges: limitations in force field accuracy and inadequate conformational sampling. Force fields are computational models that describe the forces between atoms within molecules and are fundamental to molecular dynamics (MD) simulations [2] [20]. Even with an accurate force field, insufficient sampling can fail to capture the full ensemble of relevant binding conformations, leading to inaccurate results [2]. This technical guide provides troubleshooting and best practices to navigate these challenges effectively.
Troubleshooting Guides
Guide 1: Resolving Discrepancies Between Calculated and Experimental Binding Affinities
Problem: Your calculated binding affinities consistently disagree with experimental measurements.
Solution: Systematically investigate potential sources of error related to both sampling and the force field.
1.1 Check for Sampling Equilibration
- Action: Conduct a time-series analysis of your simulation. Calculate the binding affinity or root-mean-square deviation (RMSD) in blocks over the course of the trajectory.
- Expected Outcome: The values should fluctuate around a stable average in the latter part of the simulation. If a steady drift is observed, the simulation has not equilibrated.
- Fix: Extend the simulation time until the properties of interest stabilize. For complex systems with high energy barriers, consider implementing enhanced sampling methods.
1.2 Diagnose Force Field Artifacts
- Action: Compare the structural ensemble of your unbound ligand or protein target against available experimental data, such as NMR J-couplings or nuclear Overhauser effects (NOEs) [2].
- Expected Outcome: A well-parameterized force field should reproduce experimentally observed random coil behavior or other known structural propensities.
- Fix: If the force field produces overly collapsed or ordered structures, switch to a modern force field specifically optimized for unfolded states and intrinsically disordered proteins (IDPs) [2].
1.3 Verify Concentration Regime
- Action: Ensure you are not in a "titration regime," where the concentration of the limiting binding partner is too high relative to the dissociation constant (KD) [50].
- Expected Outcome: The calculated KD should be independent of the concentration of the limiting component.
- Fix: Empirically test this by running simulations at different concentrations of the limiting component. The KD should remain constant if the system is properly configured [50].
Guide 2: Addressing Failure to Converge in Free Energy Calculations
Problem: Your free energy estimates (e.g., from MM/PBSA, MM/GBSA, or TI) show high variance and do not converge, regardless of simulation length.
Solution: Focus on improving the sampling of the conformational space contributing to the free energy.
2.1 Implement Enhanced Sampling
- Action: Replace standard molecular dynamics with advanced sampling algorithms.
- Fix: Utilize techniques such as Temperature Replica Exchange (TREx), Metadynamics, or Markov State Models (MSMs) to overcome energy barriers and sample rare events more efficiently [2] [43]. Studies have shown that non-equilibrium methods like Temperature Cool Walking (TCW) can produce qualitatively different and more accurate ensembles than TREx for some IDPs [2].
2.2 Extend Simulation Time
- Action: If enhanced sampling is not feasible, significantly increase the simulation time.
- Fix: One study on the Aβ42 peptide required ∼200 µs of aggregate sampling combined with MSM analysis to achieve an ensemble that agreed with experimental data, far exceeding what shorter simulations could capture [2].
2.3 Validate with Independent Metrics
- Action: Do not rely solely on free energy values for validation.
- Fix: Compare other simulated observables, like ensemble-averaged radii of gyration or chemical shifts, with experimental data (e.g., from SAXS or NMR) to build confidence in the underlying structural ensemble [2].
Frequently Asked Questions (FAQs)
FAQ 1: What is the most critical factor for accurate binding affinity calculations: a better force field or more sampling?
Both are intrinsically linked, and the limiting factor can depend on your system [2]. For rigid systems with a single, deep energy minimum, sampling may be less critical, and force field accuracy becomes paramount. For flexible molecules or those with shallow, complex energy landscapes (like IDPs), insufficient sampling can be the primary source of error, even with a good force field. A best practice is to use a modern, validated force field and employ robust sampling protocols.
FAQ 2: My ligand binds, but in a nonsensical pose. What went wrong?
This is often a failure of the initial docking or pose generation step. The scoring functions used in molecular docking are typically simplified for speed and may not be accurate [51]. Always validate docking poses with more rigorous methods.
- Solution: Use the docked pose only as a starting point for a subsequent, extensive MD simulation. The simulation may relax into a more thermodynamically stable pose. Alternatively, use multiple starting poses to ensure the simulation is not trapped in a local minimum.
FAQ 3: How can I model bond breaking or formation, which is impossible with standard force fields?
Standard molecular mechanics force fields cannot model chemical reactions because they use fixed bond parameters [43] [20].
- Solution: For processes involving bond breaking/formation or electronic polarization, you must use a QM/MM (Quantum Mechanics/Molecular Mechanics) hybrid approach. This method treats the reactive region quantum mechanically while the surroundings are handled with the simpler molecular mechanics force field [43].
FAQ 4: Are there standardized protocols for force field validation?
While there is no single universal checklist, validation involves demonstrating that a force field can reproduce a set of experimental observables not used in its parameterization [20]. Key validation data includes:
- Experimental binding free energies.
- Enthalpies of vaporization or sublimation.
- Liquid densities.
- Spectroscopic properties like vibrational frequencies [20].
Experimental Protocols & Workflows
Protocol 1: Binding Pose Refinement and Affinity Estimation
This protocol uses molecular docking followed by molecular dynamics to refine the binding pose and estimate affinity [51].
1. Docking: Generate multiple putative ligand-binding poses using a docking program with a custom scoring function [51]. 2. Pose Selection: Select the top-ranked poses for further analysis. 3. Molecular Dynamics Simulation: Solvate the protein-ligand complex in an explicit solvent box, add ions, and run an extended MD simulation (100 ns - 1 µs) to relax the structure and sample dynamics. 4. Analysis: * Pose Stability: Check if the ligand remains in its binding pocket and if the key interactions are maintained. * Binding Affinity: Use methods like MM/GBSA or Linear Interaction Energy (LIE) on snapshots from the trajectory to estimate the binding free energy [51].
The workflow for this protocol is illustrated below:
Protocol 2: Validation of Force Field and Sampling Method
This protocol outlines how to validate your computational approach against experimental data [2].
1. System Selection: Choose a well-characterized protein-ligand system where high-quality experimental structural and binding affinity data is available. 2. Ensemble Generation: Run multiple, independent simulations of the free protein, free ligand, and the complex using different combinations of force fields and sampling methods (e.g., standard MD vs. enhanced sampling). 3. Back-Calculation: From the simulated structural ensembles, calculate experimental observables. * For NMR: Calculate J-couplings and chemical shifts. * For FRET: Calculate distance distributions between FRET labels. 4. Comparison: Quantitatively compare the back-calculated data with the actual experimental results. The best force field/sampling combination will show the closest agreement.
The validation pipeline is as follows:
Quantitative Data Reference
Comparison of Enhanced Sampling Techniques
The table below summarizes key enhanced sampling methods used to improve conformational sampling in binding affinity calculations [2] [43].
| Technique | Computational Cost | Best For | Key Limitations |
|---|---|---|---|
| Temperature Replica Exchange (TREx) | High | Systems with enthalpic barriers, small peptides | Can be inefficient for large systems or entropic barriers [2] |
| Metadynamics | Medium to High | Exploring free energy surfaces, ligand unbinding | Requires pre-definition of collective variables (CVs) |
| Markov State Models (MSMs) | High (data analysis) | Long-timescale processes from many short simulations | Model construction and validation can be complex [2] |
| Temperature Cool Walking (TCW) | Lower than TREx | Larger systems like amyloid-β peptides | A non-equilibrium method [2] |
Essential Research Reagent Solutions
This table lists key computational "reagents" and their roles in force field validation and binding affinity studies.
| Item | Function | Example Use Case |
|---|---|---|
| Modern Force Fields (e.g., CHARMM36, AMBER99SB-ILDN, OPLS-AA) | Provides parameters for potential energy calculation; critical for accuracy [2] [20]. | Simulating intrinsically disordered proteins (IDPs) to avoid overly collapsed structures [2]. |
| Explicit Solvent Models (e.g., TIP3P, TIP4P) | Represents water molecules explicitly to model solvation effects accurately [2]. | Essential for modeling solvent-exposed binding interfaces and dehydration energies. |
| Enhanced Sampling Software Modules | Algorithms to accelerate barrier crossing and improve conformational sampling [2] [43]. | Studying ligand binding/unbinding events that occur on timescales beyond standard MD. |
| QM/MM Software Capabilities | Enables modeling of chemical reactions and charge transfer in a biomolecular environment [43]. | Studying covalent inhibitor binding or metalloenzymes where bond formation/breakage occurs. |
| Experimental Validation Data (NMR, FRET) | Provides ground-truth data for validating computational ensembles and affinities [2] [50]. | Validating that a simulated IDP ensemble matches experimental J-couplings and FRET distances [2]. |
Practical Strategies for Overcoming Common Sampling Pitfalls
Identifying and Mitigating Force Field-Specific Deficiencies
Frequently Asked Questions
What are the most common types of force field deficiencies? Common issues include the undersolvation of buried residues, overstabilization of salt-bridge interactions leading to inaccurate pKa shifts, and a general bias towards overly collapsed or ordered structural ensembles in intrinsically disordered proteins (IDPs) [21] [2]. These often stem from inaccuracies in representing electrostatic interactions, desolvation energies, and London dispersion forces.
My simulation of an intrinsically disordered protein (IDP) is too structured. Is this a sampling or force field problem? This is a classic "combined force field–sampling problem" [2]. It can be both. Some standard force fields have a known bias toward ordered states. However, even with an improved force field, inadequate sampling might fail to capture the full landscape of disordered conformations. You should address both aspects: test a force field optimized for IDPs and employ enhanced sampling techniques [2].
How can I improve the accuracy of intermolecular interactions in my simulations? Traditional force fields are often parameterized using data from pure substances, which may not accurately capture interactions in mixtures. A modern approach is to include physical property data from binary mixtures—such as densities and enthalpies of mixing—during parameter training. This better informs the Lennard-Jones parameters about cross-interactions between different molecules [52].
Can machine learning force fields (MLFFs) overcome these limitations? MLFFs are promising but face their own challenges, particularly in generalizing beyond their training data (distribution shifts) [53]. They can exhibit poor performance on out-of-distribution systems, such as those with different atomic environments or connectivity not seen during training. Strategies like test-time refinement are being developed to mitigate these issues [53].
Troubleshooting Guides
Issue: Inaccurate pKa Predictions for Buried Residues or Salt Bridges
Detailed Description of the Issue In constant pH molecular dynamics (CpHMD) simulations, you may observe significantly overestimated pKa downshifts for buried residues (like histidine) or for residues involved in salt-bridge interactions (like glutamic acid) [21]. This error arises from an undersolvation of neutral residues and an overstabilization of salt bridges by the force field.
Step-by-Step Diagnostic Protocol
- Benchmark Your Setup: Compare your simulation results for a well-studied model system (like the mini-protein BBL) against published benchmark data from all-atom CpHMD studies [21].
- Analyze the Microenvironment: Calculate the solvent-accessible surface area (SASA) of the titratable residue in question. A buried residue (low SASA) is more susceptible to this error.
- Identify Stable Interactions: Monitor the dynamics of the salt bridge. An over-stabilized, non-breaking salt bridge is a key indicator of this force field deficiency [21].
Recommended Mitigation Strategies
- Force Field and Water Model: Use a modern protein force field like Amber ff19sb paired with a more accurate water model such as OPC, which has shown improved accuracy over older combinations like ff14sb/TIP3P [21].
- Non-Bonded Fix (NBFIX): Apply atom-pair specific corrections to the Lennard-Jones parameters (NBFIX), which can partially alleviate the overstabilization of salt bridges [21].
- Review Protonation State Sampling: Ensure your CpHMD simulation uses an explicit solvent representation for both conformational and protonation state sampling, as this improves accuracy over implicit-solvent methods [21].
Issue: Overly Collapsed or Structured Ensembles for IDPs
Detailed Description of the Issue Simulations of intrinsically disordered proteins (IDPs) like amyloid-beta (Aβ) result in structural ensembles that are overly collapsed and contain unrealistic amounts of persistent secondary structure (α-helix or β-sheet), contradicting experimental data which show they are largely random coils [2].
Step-by-Step Diagnostic Protocol
- Compare with Experimental Data: Validate your simulation ensemble against experimental observables. Key metrics include:
- Radius of Gyration (Rg): Is the simulated Rg too small compared to Small-Angle X-ray Scattering (SAXS) data?
- Scalar J-Couplings and NOEs: Do back-calculated J-couplings and nuclear Overhauser effects (NOEs) match NMR measurements? A lack of long-range NOEs and agreement with random coil J-couplings is expected for IDPs [2].
- FRET Data: Does the simulated ensemble match distance distributions derived from single-molecule FRET experiments? [2]
- Check Secondary Structure Propensity: Quantify the percentage of helical and β-sheet content in your ensemble. Persistent structure above ~5-10% in regions known to be disordered is a red flag [2].
Recommended Mitigation Strategies
- Evaluate Sampling Adequacy: The problem may not be the force field alone. Test different enhanced sampling methods. Temperature Replica Exchange (TREx) may be insufficient; consider alternatives like Temperature Cool Walking (TCW) or Markov State Models (MSMs) which can produce more accurate, expanded ensembles even with standard force fields [2].
- Use IDP-Optimized Force Fields: If enhanced sampling confirms the issue, switch to a force field that has been specifically refined for disordered proteins. These often have adjusted protein-water dispersion interactions or refined backbone torsional potentials [2].
Issue: Poor Performance in Simating RNA-Ligand Complexes
Detailed Description of the Issue In simulations of RNA–small molecule complexes, the RNA structure may become distorted, or the RNA-ligand interactions may be unstable, leading to the ligand dissociating or adopting incorrect binding modes [7].
Step-by-Step Diagnostic Protocol
- Monitor Root-Mean-Square Deviation (RMSD): Track the RMSD of the RNA backbone relative to the experimental starting structure. Large, systematic drifts suggest the force field is not stabilizing the native architecture.
- Calculate Ligand-Only RMSD (LoRMSD): Align the trajectory on the RNA backbone and then compute the RMSD of the ligand heavy atoms. This directly measures ligand mobility and binding stability [7].
- Analyze Native Contacts: Define the ligand-RNA contacts present in the experimental structure and calculate their occupancy throughout the simulation. A rapid loss of native contacts indicates a problem [7].
Recommended Mitigation Strategies
- Test State-of-the-Art Force Fields: Use recently refined RNA force fields, which generally show better maintenance of intra-RNA interactions and reduced terminal fraying [7].
- Apply Specific Corrections: For certain force fields like OL3, apply the
gHBfix21correction term during the production simulation to improve the stability of hydrogen bonding networks [7]. - Validate the Experimental Model: Be aware that the crystal structure itself may have local distortions introduced during the refinement process under limited experimental restraints. In some cases, MD simulations with a good force field can actually correct these local distortions [7].
Issue: General Force Field Validation for Specific Materials
Detailed Description of the Issue When simulating a specific material system (e.g., a polyamide membrane), results for properties like density, Young's modulus, or permeability can vary significantly depending on the chosen force field, and may not match experimental measurements [54].
Step-by-Step Diagnostic Protocol
- Define Key Properties: Identify the critical experimental properties you need to reproduce (e.g., dry density, porosity, Young's modulus, water permeability) [54].
- Benchmark Multiple Force Fields: Set up identical simulation systems and protocols for a range of force fields relevant to your material.
- Compare Quantitatively: Systematically compare the simulated properties against high-quality experimental data to identify the best-performing force field for your specific application [54].
Recommended Mitigation Strategies
- Select a Top-Performing Force Field: Based on benchmarking studies, choose a force field that has been validated for your system. For example, for polyamide membranes, CVFF, SwissParam, and CGenFF have shown good performance for structural and mechanical properties, while GAFF and CGenFF were more accurate for water permeability predictions [54].
- Pay Attention to the Water Model: The choice of water model (TIP3P, TIP4P, etc.) is integral to the force field's performance and must be consistent with the parameterization. Test different water models if necessary [54].
Quantitative Data on Force Field Performance
Table 1: pKa Calculation Errors for Different Force Field and Water Model Combinations on the BBL Protein (Data from [21])
| Residue & Environment | Force Field / Water Model | pKa Error Magnitude | Notes |
|---|---|---|---|
| Buried His166 | Amber ff14sb / TIP3P | Largest overestimated downshift | Significant undersolvation of neutral histidine |
| Buried His166 | Amber ff19sb / OPC | Large overestimated downshift | More accurate than ff14sb/TIP3P, but error persists |
| Glu involved in salt-bridge | Amber ff14sb / TIP3P | Largest overestimated downshift | Overstabilization of salt-bridge interaction |
| Glu involved in salt-bridge | Amber ff19sb / OPC | Large overestimated downshift | Improved accuracy over ff14sb/TIP3P |
| Salt-bridge residues | With NBFIX correction | Reduced downshift | Partially alleviates error |
Table 2: Performance of Various Force Fields for Simulating Polyamide Membranes (Data from [54])
| Force Field | Dry State Density & Young's Modulus | Pure Water Permeability | Overall Recommendation |
|---|---|---|---|
| PCFF | Poor | Poor | Not recommended |
| CVFF | Accurate | Under-predicts | Good for structural properties |
| SwissParam | Accurate | Under-predicts | Good for structural properties |
| CGenFF | Accurate | Accurate (within 95% CI) | Recommended |
| GAFF | Less accurate | Accurate (within 95% CI) | Recommended for permeability |
| DREIDING | Poor | Poor | Not recommended |
The Scientist's Toolkit: Research Reagent Solutions
Table 3: Essential Software and Force Fields for Troubleshooting
| Tool Name | Type | Primary Function | Example Use Case |
|---|---|---|---|
| Amber CpHMD [21] | Simulation Package / Module | All-atom constant pH molecular dynamics | Predicting pKa values of titratable residues in proteins. |
| PLUMED [7] | Plugin | Enhanced sampling and free energy calculations | Applying gHBfix corrections in RNA simulations; running metadynamics. |
| OpenMM [2] | Simulation Package | High-performance MD simulation, including GPU acceleration | Implementing advanced sampling algorithms like Temperature Cool Walking (TCW). |
| VASP MLFF [55] | Module | Generating machine-learned force fields | Creating system-specific force fields from ab-initio data. |
| CHARMM/Amber [21] | Simulation Packages | General-purpose molecular dynamics | Running simulations with established biomolecular force fields (CHARMM, AMBER). |
| NBFIX [21] | Parameter Correction | Atom-pair specific Lennard-Jones correction | Correcting over-stabilized salt-bridge interactions in simulations. |
| gHBfix21 [7] | Parameter Correction | Hydrogen-bond geometry correction in RNA | Improving stability of RNA structures and RNA-ligand complexes. |
Workflow for Diagnosing Force Field Deficiencies
The following diagram outlines a systematic workflow for identifying and addressing potential force field issues in your research.
Troubleshooting Guide: Force Fields and Sampling
Why does my IDP simulation show excessive helical content or overly compact structures?
This is a common issue where the force field over-stabilizes secondary structures. The solution involves using IDP-optimized force fields and adjusting simulation parameters.
- Root Cause: Traditional force fields like AMBER ff99SB or CHARMM22 were parameterized primarily using data from folded, structured proteins. This can lead to an inherent bias toward folded states, resulting in over-stabilized secondary structures like α-helices and β-sheets, and incorrect compactness for intrinsically disordered proteins (IDPs) [56] [57].
- Solutions:
- Switch to a specialized force field: Use force fields specifically designed for IDPs, such as ff14IDPs or ff99IDPs in the AMBER family [57]. These are created by correcting the backbone dihedral parameters for disorder-promoting amino acids (Gly, Ala, Ser, Pro, Arg, Gln, Glu, Lys) using data from coil regions in the PDB [57].
- Use modern, rebalanced force fields: Newer general-purpose force fields like CHARMM36 and ff99SB* have undergone corrections to better balance the propensity for folded and disordered states [56].
- Refine dihedral parameters: Some force field strategies, like those in ff99SB and ff03, adjust dihedral parameters using theories like Lifson–Roig helix–coil theory to achieve a better balance between helical and coil structures [56].
- Employ a compatible water model: The choice of water model is crucial. For instance, the TIP3P water model is often used with corrections, while the TIP4P/2005 model has shown improvements with force fields like ff03w [56].
How can I efficiently sample the diverse conformational landscape of an IDP?
Standard Molecular Dynamics (MD) simulations may be too slow to capture the full range of IDP conformations. Enhanced sampling and AI methods can overcome this.
- Root Cause: IDPs exist as a dynamic ensemble of interconverting conformations. Capturing this diversity requires sampling on timescales that are often computationally prohibitive for standard MD, causing simulations to get trapped in local energy minima and miss rare, biologically relevant states [58].
- Solutions:
- Leverage Artificial Intelligence: Deep learning (DL) methods can efficiently generate diverse conformational ensembles by learning complex sequence-to-structure relationships from large datasets. These AI-generated ensembles can achieve accuracy comparable to MD but much faster [58].
- Use Enhanced Sampling MD: Techniques like Gaussian accelerated MD (GaMD) enhance the sampling of rare events, such as proline isomerization in IDPs, which can act as conformational switches regulating biological function [58].
- Apply Replica Exchange MD (REMD): This method runs multiple replicas of the system at different temperatures, allowing conformations to escape local energy traps and explore a broader conformational space [56].
- Consider Hybrid Approaches: Combine the speed of AI for broad sampling with the physical accuracy of MD for refinement. AI can generate initial ensembles, which are then validated or refined using short, targeted MD simulations [58].
What are the critical steps for building a stable membrane protein simulation?
Simulations of membrane proteins require careful assembly to mimic the natural lipid environment and achieve thermodynamic stability.
- Root Cause: Incorrect lipid packing, unrealistic protein insertion, or inappropriate system size can lead to unstable simulations where the membrane deforms, the protein denatures, or the system fails to equilibrate [59].
- Solutions:
- Select an Appropriate Lipid Model: Choose a lipid model that matches the resolution of your protein model (all-atom, united-atom, coarse-grained). Ensure the lipid composition reflects the biological context of your protein [59].
- Ensure High Hydration: Use a sufficient water buffer (e.g., >20 Å) around the membrane to properly hydrate the lipid headgroups and mimic a dilute lamellar system [59].
- Careful System Assembly: Use established tools and protocols (e.g., within GROMACS, CHARMM, or AMBER) to build a planar bilayer and correctly insert the protein. Avoid unrealistic initial clashes between the protein and lipid tails [59].
- Run a Stepwise Equilibration: Do not jump directly into production runs. Follow a rigorous equilibration protocol:
- Energy minimization to remove steric clashes.
- Gradual heating in the NVT ensemble.
- Equilibration of pressure and membrane area in the NPT ensemble, monitoring properties like area per lipid and membrane thickness until they stabilize [59].
Force Field Comparison Tables
Table 1: IDP Force Field Strategies and Characteristics
| Force Field | Base Force Field | Correction Strategy | Key Features / Applications |
|---|---|---|---|
| ff14IDPs [57] | AMBER ff14SB | CMAP correction for 8 disorder-promoting residues | Improves conformation sampling of IDPs; compatible with structural proteins. |
| *ff99SB* [56] | AMBER ff99SB | Adjustment of backbone dihedral parameters | Better balance for folded proteins and short peptides; can under-estimate helicity. |
| CHARMM36 [56] | CHARMM22/CMAP | Refined protein-water interactions, CMAP | Balanced helix/coil propensity; improved for IDPs like α-synuclein. |
| RSFF2 [56] | AMBER ff99SB | Residue-specific dihedral parameters | Folds α-helix and β-sheet structures; addresses over-stabilization. |
| OPLS-AA/M [56] | OPLS-AA | Reparameterization of backbone/side-chain dihedrals | Good for proline and glycine peptides; applicable to IDPs. |
| Force Field | IDP Conformational Sampling | Secondary Structure Propensity | Performance on Folded Proteins | Recommended Use Case |
|---|---|---|---|---|
| ff14IDPs | Improved agreement with NMR chemical shifts [57] | Reduced over-stabilization [57] | Good performance (e.g., lysozyme, ubiquitin) [57] | Primary choice for IDP studies |
| CHARMM36 | Improved for some IDPs (e.g., vs. CHARMM27) [56] | Balanced helix and coil populations [56] | High quality for structured proteins [56] | General purpose, including disordered systems |
| ff99SB* | Varies (underestimation possible) [56] | Can underestimate helical content [56] | Good agreement with NMR for folded proteins [56] | Systems where ff99SB over-stabilizes structure |
Detailed Experimental Protocols
Protocol 1: Validating an IDP-Specific Force Field with NMR Chemical Shifts
This protocol outlines how to validate the performance of a force field for an IDP by comparing calculated properties to experimental NMR data [57].
System Setup:
- Construct the initial extended conformation of the IDP using a molecular builder.
- Solvate the protein in a truncated octahedron water box with a minimum 10 Å buffer using the TIP3P water model.
- Add counter-ions to neutralize the system's charge.
Simulation Parameters:
- Use the Particle Mesh Ewald (PME) method for long-range electrostatics.
- Apply the SHAKE algorithm to constrain bonds involving hydrogen atoms.
- Perform energy minimization (20,000 steps) followed by a gradual heating and equilibration phase.
Production Simulation:
- Run ten independent trajectories of 100-140 ns each at 298 K to ensure adequate sampling of the conformational ensemble. Using multiple trajectories helps improve statistical sampling [57].
Analysis and Validation:
- From the combined trajectories, calculate the secondary chemical shifts (the difference between the observed chemical shift and the random coil value).
- Compare the calculated secondary chemical shifts directly to those obtained from experimental NMR data. Quantitative agreement indicates the force field is accurately sampling the IDP's conformational ensemble [57].
Protocol 2: Computational Design of Binders for IDPs using RFdiffusion
This protocol describes a modern AI-based approach to designing proteins that bind to specific IDPs, as demonstrated in a recent Nature study [60].
Input Preparation:
- Provide only the amino acid sequence of the target IDP or IDR as input. No pre-specified target geometry is required.
Generative Design with RFdiffusion:
- Run RFdiffusion, which has been fine-tuned for two-chain systems. The algorithm will simultaneously sample a wide range of conformations for both the target IDP and the potential binder.
- The process involves sequential denoising steps where the binder organizes around a specific conformation of the target, achieving high shape complementarity [60].
Sequence Design and Filtering:
- For the generated binder backbone structures, design amino acid sequences using ProteinMPNN.
- Filter the resulting designs using AlphaFold2 (AF2) to check the stability of the monomer and the complex.
Affinity Optimization (Optional):
- For higher affinity, employ a two-sided partial diffusion strategy. This method further samples variations in both the target and binder conformations, often leading to designs with more extensive interactions and better shape complementarity than one-sided diffusion [60].
The Scientist's Toolkit
Table 3: Key Research Reagent Solutions
| Item | Function | Example / Note |
|---|---|---|
| Specialized Force Fields | Corrects energy potentials for accurate IDP/membrane sampling. | ff14IDPs [57], CHARMM36 [56], Slipids [59] |
| MD Software Packages | Engine to run simulations; includes force fields and analysis tools. | GROMACS [59], NAMD [59], AMBER [59] [57], CHARMM [59] |
| AI Design Tools | Generates binder proteins or conformational ensembles from sequence. | RFdiffusion (binder design) [60], ProteinMPNN (sequence design) [60] |
| Analysis Software | Analyzes trajectories to compute properties like chemical shifts or structure. | MDAnalysis [59], MDTraj [59] |
| Enhanced Sampling Algorithms | Accelerates exploration of conformational space and rare events. | Gaussian accelerated MD (GaMD) [58], Replica Exchange MD (REMD) [56] |
Workflow Diagrams
Force Field Selection Workflow
AI-MD Integration for Sampling
Frequently Asked Questions (FAQs)
What is the most common pitfall when simulating IDPs for the first time?
The most common pitfall is using a standard force field designed for folded proteins. This almost guarantees a biased outcome, such as an unrealistically structured or compact IDP. Always begin with an IDP-optimized or modern general-purpose force field like ff14IDPs or CHARMM36 [56] [57].
Can I use a force field designed for IDPs to simulate folded proteins?
Yes. Tests have shown that force fields like ff14IDPs can successfully simulate structured proteins like lysozyme and ubiquitin, with some reports suggesting even better performance in coil regions compared to the base ff14SB force field [57].
My membrane simulation is unstable. Which initial checks should I perform?
First, check the area per lipid and membrane thickness during equilibration. If these values are fluctuating wildly or drifting, your system is not stable. Ensure you have followed a stepwise equilibration protocol (minimization, heating, pressure coupling) and that the membrane protein is properly inserted without severe clashes with the lipid tails [59].
How does the "CMAP correction" work in force fields like ff14IDPs?
CMAP is a grid-based energy correction map applied to the backbone dihedral angles (φ and ψ). It works by comparing the dihedral distribution from a benchmark dataset (e.g., coil fragments from PDB) to the distribution generated by the base force field. A correction energy is then applied to make the simulation's dihedral distribution match the benchmark data more closely, thus improving the sampling of disordered states [56] [57].
Balancing Computational Cost Against Sampling Requirements
Frequently Asked Questions (FAQs)
1. What are the most critical sampling limitations in force field validation? The most critical limitations stem from the fundamental trade-off between computational expense and the need to observe rare events. Molecular dynamics (MD) simulations are typically limited to microseconds at most, while many biochemical processes like receptor conformational shifts relevant to drug binding occur on much longer timescales [61]. This inadequate sampling can lead to incomplete representation of the system's configurational space, potentially missing important metastable states or transition pathways.
2. How can I determine if my simulation has run long enough for adequate sampling? Adequate sampling can be assessed through quantitative uncertainty quantification. Best practices include:
- Calculating the experimental standard deviation of the mean using the formula:
s(x̄) = s(x)/√nwheres(x)is the sample standard deviation andnis the sample size [1] - Analyzing correlation times of key observables to ensure you've sampled multiple decorrelation events
- Performing convergence tests on thermodynamic and dynamic properties of interest
- Using multiple independent simulations to assess reproducibility of results [1]
3. What strategies can help reduce computational costs without sacrificing sampling quality? Several strategies can help optimize this balance:
- Enhanced sampling methods like metadynamics, umbrella sampling, or accelerated MD can help overcome energy barriers more efficiently [62] [61]
- Machine learning approaches can identify key collective variables or create surrogate models that reduce the need for exhaustive sampling [62] [63]
- Adaptive sampling strategies that focus computational resources on undersampled regions of configurational space [62]
- Multi-scale modeling approaches that combine different levels of theory [61]
4. How does force field choice impact sampling requirements? The force field significantly impacts both accuracy and sampling efficiency. Traditional parameterized force fields (AMBER, CHARMM, GROMOS) are fast but may lack accuracy and transferability [61]. Machine learning-based force fields offer quantum-mechanical accuracy but require careful training data preparation [63]. Poor force field accuracy can lead to systematic errors that cannot be overcome by increased sampling alone [1].
5. What are the best practices for quantifying uncertainty in simulation results? Proper uncertainty quantification should include:
- Tiered approach: Begin with feasibility calculations, followed by simulations, then qualitative checks before final estimates [1]
- Accounting for correlations: Using methods that handle time-correlated data rather than assuming uncorrelated samples [1]
- Multiple independent runs: Assessing variability between different trajectories [1]
- Clear communication: Reporting both statistical uncertainties and methodological limitations [1]
Troubleshooting Guides
Problem: Inadequate Sampling of Rare Events
Symptoms
- Failure to observe known conformational changes within simulation timeframe
- Poor convergence of free energy estimates
- Large statistical uncertainties in computed observables
Solution
Step-by-Step Protocol
- Diagnose the specific bottleneck: Identify whether the issue involves high energy barriers, insufficient simulation time, or poor reaction coordinates [62]
- Select appropriate enhanced sampling:
- Validate enhanced sampling with known benchmarks before applying to unknown systems
- Ensure proper reweighting to recover unbiased statistics from biased simulations
Problem: High Computational Costs Limiting Simulation Length
Symptoms
- Inability to reach biologically relevant timescales
- Limited sampling of phase space
- Compromise between system size and simulation duration
Solution Step-by-Step Protocol
- Optimize computational efficiency:
- Apply intelligent sampling strategies:
- Leverage machine learning force fields:
Problem: Force Field Inaccuracies Affecting Results
Symptoms
- Systematic deviations from experimental or quantum mechanical reference data
- Poor transferability to conditions outside parameterization set
- Unphysical structural or dynamic behavior
Solution Step-by-Step Protocol
- Validate against reference data:
- Systematically improve force fields:
- Quantify and account for systematic errors in uncertainty estimates [1]
Computational Cost and Sampling Capabilities
| Method | Typical Timescale | System Size | Relative Cost | Key Limitations |
|---|---|---|---|---|
| Conventional MD [61] | Nanoseconds to microseconds | 10,000-100,000 atoms | Baseline | Limited by rare events |
| Accelerated MD [61] | Microseconds to milliseconds | Similar to conventional MD | 2-5x conventional | Potential artifacts in kinetics |
| Machine Learning MD [63] | Similar to conventional MD | Similar to conventional MD | 6-8 orders cheaper than DFT | Training data dependency |
| Specialized Hardware (Anton) [61] | Milliseconds to seconds | ~50,000 atoms | Requires access to specialized resources | Limited availability |
Uncertainty Quantification Methods
| Method | Application | Requirements | Key Advantages |
|---|---|---|---|
| Block Averaging [1] | Time-correlated data | Single long trajectory | Simple implementation |
| Bootstrap Resampling [1] | General uncertainty estimation | Multiple samples | Non-parametric, robust |
| Jackknife Resampling [1] | Bias reduction | Multiple samples | Good for small datasets |
| Bayesian Inference [1] | Complex models | Computational resources | Provides full posterior distribution |
Experimental Protocols
Protocol 1: Systematic Force Field Validation
Detailed Methodology
- Reference Data Preparation
Fingerprinting Atomic Environments
- Use structural fingerprints that are invariant to translations, rotations, and permutations [63]
- Implement directionally resolved fingerprints for force prediction:
V_i,α;k = Σ_j (r_ij^α/r_ij) · (1/√(2π)w) · exp[-½((r_ij - a_k)/w)²] · f_c(r_ij)[63] - Ensure fingerprints change continuously with atomic arrangement [63]
Training and Validation
Protocol 2: Uncertainty Quantification for MD Simulations
Detailed Methodology
- Preliminary Assessment
Statistical Analysis
Convergence Testing
- Monitor evolution of observables with simulation time
- Compare results from multiple independent trajectories
- Assess statistical precision against required accuracy [1]
The Scientist's Toolkit: Research Reagent Solutions
Essential Software and Tools
| Tool | Function | Key Features |
|---|---|---|
| AMBER [61] | MD Simulation | Traditional force fields, well-established |
| CHARMM [61] | MD Simulation | Polarizable force fields available |
| NAMD [61] | MD Simulation | Efficient parallelization |
| PLUMED [62] | Enhanced Sampling | Collective variable analysis, metadynamics |
| AGNI [63] | ML Force Fields | Direct force prediction, quantum accuracy |
Force Field Options
| Force Field Type | Best For | Key Considerations |
|---|---|---|
| Traditional (AMBER, CHARMM) [61] | Standard biomolecular systems | Fast, established parameters |
| Polarizable [61] | Systems with electronic effects | More accurate, computationally expensive |
| Machine Learning [63] | Quantum accuracy needs | Training data dependent, rapidly improving |
| UFF [64] | General materials | Broad coverage, moderate accuracy |
Analysis and Validation Tools
| Tool | Purpose | Key Application |
|---|---|---|
| Uncertainty Quantification [1] | Statistical validation | Assessing sampling quality |
| Clustering Algorithms [63] | Training set selection | Identifying diverse atomic environments |
| Markov State Models [62] | Kinetic analysis | Extracting rates from simulations |
| Machine Learning CVs [62] | Dimensionality reduction | Identifying relevant collective variables |
Addressing Electrostatic and Solvation Artifacts in Complex Systems
Key Concepts: Understanding the Artifacts
In force field-based simulations of complex biological systems, such as proteins and ligand complexes, several inherent limitations of common computational methods can introduce significant electrostatic and solvation artifacts. These artifacts can compromise the accuracy of calculated thermodynamic properties, including binding free energies and pKa values, which are critical for computer-aided drug design. Understanding these artifacts is the first step toward their correction.
Net-Charge Change Artifacts: Alchemical free energy calculations, where a molecule is virtually transformed into another, are particularly prone to error when the perturbation involves a change in net charge. The use of Periodic Boundary Conditions (PBC) with lattice-summation methods like Particle Mesh Ewald (PME) or cutoff schemes makes the calculated charging free energies sensitive to simulation parameters like box size and cutoff radius. This sensitivity introduces artifacts that do not reflect the true physical behavior of the system [65].
Finite-Size Artifacts and Solvation: Simulations employ microscopic system sizes and effective electrostatic interaction functions for computational feasibility. This setup leads to spurious configurational sampling because the simulated environment does not accurately represent the macroscopic solvation and polarization of a real system. The solvent polarization around a solute in a small, periodic box deviates from the ideal Born polarization model [66].
Force Field Dependencies: The accuracy of protonation equilibria and salt-bridge interactions, which are governed by electrostatic interactions and desolvation energies, is highly sensitive to the underlying protein force field and water model. For example, certain force fields can over-stabilize salt bridges and undersolvate buried residues, leading to inaccurate pKa predictions for key acidic and basic residues [39].
The diagram below illustrates the logical pathway of how these core limitations manifest as tangible errors in simulation outcomes.
Troubleshooting FAQs and Guides
This section provides targeted solutions for specific problems researchers encounter.
FAQ 1: How do I correct for artifacts in binding free energies when my ligand's net charge changes?
- Problem: My calculated binding free energies for charged ligands show a strong dependence on the simulation box size or the electrostatic treatment (e.g., cutoff radius), making the results unreliable.
- Background: This is a known artifact in alchemical free energy calculations. The effective electrostatic interactions within a periodic system mean that the work of charging a solute is influenced by its periodic images and the specific treatment of long-range electrostatics [65].
- Solution:
- Post-Processing Correction: After the simulation, the raw binding free energy data can be corrected using analytical expressions that account for the artifact. These terms often involve the box size and the dielectric properties of the solvent [65].
- On-the-Fly Force Correction: A more integrated approach involves applying restraints during the simulation itself. For instance, you can restrain the solvent-generated electrostatic potential at the solute site or the long-range solvent polarization to match the ideal Born model. This method directly corrects the forces during configurational sampling [66].
FAQ 2: Why are the calculated pKa values for my protein's buried residues or salt-bridge partners significantly shifted from experimental values?
- Problem: Constant pH molecular dynamics simulations yield pKa values for certain residues (e.g., a buried histidine or a glutamic acid in a salt bridge) that are much lower or higher than expected.
- Background: This error often stems from force field limitations. Common issues are the undersolvation of neutral histidines in buried environments and the over-stabilization of salt-bridge interactions, which artificially favor the charged state and thus skew the pKa [39].
- Solution:
- Evaluate and Change Force Field/Water Model: Test a different, more modern protein force field. Benchmarking shows that Amber ff19sb with the OPC water model can provide significantly more accurate pKa values than older combinations like ff14sb with TIP3P water [39].
- Utilize Specific Lennard-Jones Corrections (NBFIX): Apply atom-pair specific corrections to the non-bonded parameters. These NBFIX corrections can partially alleviate the over-stabilization of salt bridges and improve pKa predictions [39].
- Ensure Sufficient Sampling: Use enhanced sampling techniques like replica-exchange pH titration to ensure adequate sampling of both protonation states and conformational states, which is crucial for convergence [39].
FAQ 3: My simulations use PME for electrostatics. How can I visualize the electrostatic potential to diagnose issues?
- Problem: I want to visualize the electrostatic landscape around my protein to understand potential binding pockets or problematic charge distributions.
- Background: The electrostatic potential (ESP) is a key determinant in molecular recognition and binding. Visualizing it can reveal areas that are overly positive or negative due to force field or solvation artifacts.
- Solution:
- Particle Mesh Ewald (PME) Potential: Tools like YASARA can use the reciprocal space part of the Ewald summation to generate a smoothed, long-ranged electrostatic potential in vacuo. This is useful for visualizing the overall electrostatic field without solvent effects [67].
- Poisson-Boltzmann (PBS) Potential: For a more detailed view that includes implicit solvent and counterions, solve the Poisson-Boltzmann equation using programs like APBS. The PBS potential shows more short-range details and represents the solvated state [67].
- Visualization Styles: Use different visualization styles for clarity:
- Surface Style: Colors the molecular surface according to the ESP (e.g., blue for positive, red for negative).
- Contour Style: Displays 3D isosurfaces of a specific positive and negative potential value.
- Density/Points Style: Shows the ESP at each point on a 3D grid [67].
The following workflow provides a systematic procedure for diagnosing and resolving solvation-related artifacts.
Quantitative Data and Methodologies
The table below summarizes key approaches for addressing different types of electrostatic and solvation artifacts.
| Artifact Type | Correction Method | Key Principle | Example Application |
|---|---|---|---|
| Net-Charge Change Artifacts [65] | Post-processing Analytical Correction | Applies analytical terms post-simulation to correct for periodicity and cutoff effects. | Ligand binding free energy calculations where the ligand's charge changes during the alchemical transformation. |
| Finite-Size Solvation Artifacts [66] | On-the-fly Solvent Potential/Polarization Restraints | Restrains the solvent-generated potential or long-range polarization to a macroscopic target during MD. | Calculating accurate solvation free energies of ions or charged molecules in explicit solvent. |
| Force Field Dependent pKa Errors [39] | Force Field & Water Model Selection | Using a modern force field (e.g., ff19sb) with a more accurate water model (e.g., OPC). | Constant pH MD simulations to obtain correct pKa values for buried residues or those in salt bridges. |
| Salt Bridge Over-stabilization [39] | NBFIX (Lennard-Jones Corrections) | Applies atom-pair specific corrections to non-bonded parameters to prevent over-stabilization. | Improving the pKa prediction for acidic residues involved in salt-bridge interactions. |
Research Reagent Solutions: A Computational Toolkit
This table lists essential software tools and methodological "reagents" used in the field to address these challenges.
| Tool / Method | Function | Relevance to Artifact Correction |
|---|---|---|
| Particle Mesh Ewald (PME) [65] [67] | An algorithm for handling long-range electrostatic interactions in periodic systems. | The standard method whose artifacts (box-size dependence) often need correction. Provides the basis for in vacuo potential visualization. |
| Poisson-Boltzmann Solver (e.g., APBS) [67] | A numerical solver to calculate electrostatic potentials in implicit solvent. | Used for calculating reference solvation energies and visualizing ESP with solvent effects, serving as a benchmark. |
| Hybrid Solvent CpHMD [39] | A constant pH MD method using explicit solvent for conformation and implicit solvent for protonation. | A tool for pKa calculation that is less computationally expensive than all-atom methods but may have its own limitations. |
| All-Atom PME CpHMD [39] | A constant pH MD method using explicit solvent for both conformation and protonation state sampling. | The state-of-the-art for pKa calculation, whose accuracy is directly dependent on the quality of the underlying force field. |
| NBFIX Parameters [39] | Specific corrections to the Lennard-Jones parameters between particular atom pairs. | Used to correct for known force field deficiencies, such as the over-stabilization of salt bridges or ion-pair interactions. |
Frequently Asked Questions (FAQs)
Q1: What are the main limitations of pure physics-based sampling that hybrid approaches aim to solve? Pure Molecular Dynamics (MD) simulations are computationally expensive and struggle to sample the full conformational landscape, especially rare, transient states that can be biologically critical for processes like protein-protein interactions [58]. Their long timescales—often microseconds to milliseconds—make large-scale studies impractical [58].
Q2: How does a hybrid model improve force field validation over a purely data-driven AI model? Hybrid models integrate the robust mathematical foundation and interpretability of physics-based modeling with the scalability of AI [68]. While AI can learn complex patterns from data, it can be a "black box" with questionable prediction confidence for critical systems [68]. A hybrid approach uses physics to generate accurate synthetic data for training, resulting in a model that is both physically plausible and efficient for live data analysis [68].
Q3: What is a key data consideration when building a hybrid force field? Data efficiency is crucial. Advanced strategies, like the PhyNEO-Electrolyte method, rely on a careful separation of interactions (long/short-range, bonding/non-bonding) and use only monomer and dimer energy decomposition analysis (EDA) data. This significantly improves data efficiency, enabling broader chemical space coverage with less data while retaining predictive power [69].
Q4: In the context of IDPs, why are hybrid methods particularly valuable? Intrinsically Disordered Proteins (IDPs) exist as dynamic ensembles, challenging traditional structural biology methods [58]. Deep Learning (DL) models can efficiently sample these conformational landscapes but face challenges like dependence on data quality and limited interpretability [58]. Hybrid AI-MD approaches bridge this gap by integrating statistical learning with thermodynamic feasibility, offering a balanced solution for exploring IDP conformational space [58].
Q5: Can you give an example of a successful hybrid methodology? The PhyNEO-Electrolyte force field is a highly scalable, fully bottom-up construction strategy [69]. It uses a hybrid physics-driven and data-driven method, rigorously restoring long-range asymptotic behavior—critical for electrolyte systems—through careful separation of interaction types. This results in high data efficiency and reliable quantitative predictions in bulk phase calculations [69].
Troubleshooting Guides
Issue 1: Poor Transferability and Stability in Bulk Property Prediction
Problem: Your machine learning interatomic potential (MLIP) fails to accurately predict bulk properties or behaves unstably when applied to systems beyond its initial training data.
| Symptoms | Possible Causes | Recommended Solutions |
|---|---|---|
| Unphysical energy drift during simulation [69] | Model has learned artifacts from the limited ab initio dataset instead of general physics [69]. | Adopt a hybrid physics-driven approach. Incorporate physics-based constraints and long-range interaction terms (e.g., Coulomb, van der Waals) that are not easily learned from data alone [69] [58]. |
| Inaccurate density, viscosity, or diffusion coefficients in bulk phase [69] | MLIP lacks data efficiency and chemical space coverage, leading to poor extrapolation [69]. | Use a bottom-up training strategy. Rely on monomer and dimer EDA data to build the potential, which improves data efficiency and expands reliable chemical space coverage [69]. |
| Poor performance on rare event sampling (e.g., ion pairing) [58] | Standard MD sampling is insufficient; model is not exposed to these states [58]. | Integrate with enhanced sampling MD techniques (e.g., Gaussian accelerated MD) or use AI to generate initial conformations for further physical refinement [58]. |
Issue 2: Inefficient Sampling of Rare Biological Events
Problem: Your molecular simulations are unable to adequately sample rare, functionally relevant conformational states, such as transient binding poses or protein folding intermediates, within a feasible computational time.
| Symptoms | Possible Causes | Recommended Solutions |
|---|---|---|
| Simulation remains trapped in local energy minima [58]. | The energy barriers between states are too high for conventional MD to overcome on practical timescales [58]. | Employ a hybrid AI-MD workflow. Use a deep learning model (trained on MD data or physical principles) to generate diverse candidate conformations or propose moves that accelerate state exploration [58]. |
| Failure to observe a known biological event (e.g., proline isomerization) [58]. | The rare event occurs on a timescale much longer than what can be simulated with full physics [58]. | Leverage Gaussian accelerated MD (GaMD) to boost sampling. This physics-based method smooths the energy landscape, making it easier to observe rare events like proline isomerization that act as functional switches [58]. |
| AI-generated conformations are thermodynamically unrealistic. | The AI model lacks physical constraints and operates purely on statistical patterns [58]. | Incorporate physics-based constraints and penalties into the deep learning framework's loss function to ensure generated ensembles align with thermodynamic principles [58]. |
Workflow Diagram: Hybrid AI-Physics Sampling
Troubleshooting Logic: Force Field Validation
The Scientist's Toolkit: Research Reagent Solutions
| Item/Technique | Function in Hybrid Approach |
|---|---|
| Molecular Dynamics (MD) Simulations | Provides the foundational physics-based modeling, generating high-fidelity synthetic data and serving as a benchmark for validating hybrid model predictions [69] [58]. |
| Machine Learning Interatomic Potentials (MLIP) | Acts as the core AI component, trained on MD and/or quantum chemical data to create a fast, scalable surrogate model for energy and force calculations [69]. |
| Energy Decomposition Analysis (EDA) | A critical data source for bottom-up force field construction. Using monomer and dimer EDA data improves data efficiency and enables accurate modeling of intermolecular interactions [69]. |
| Enhanced Sampling MD (e.g., GaMD) | Specialized physics-based techniques used to accelerate the sampling of rare events and complex energy landscapes, which can then be used to train and validate the AI component [58]. |
| Experimental Validators (NMR, SAXS) | Used to ground-truth the hybrid model's predictions. Ensures the generated conformational ensembles align with real-world observable physical and biochemical properties [58]. |
Robust Validation Frameworks and Comparative Force Field Assessment
Core Concepts: Why Move Beyond RMSD?
The Limitations of Root-Mean-Square Deviation (RMSD)
While RMSD is a widely used metric for assessing the deviation of a simulated structure from an experimental reference, it presents several critical limitations for comprehensive force field validation [70]:
- Global vs. Local Accuracy: A low overall RMSD can mask significant local structural inaccuracies, such as misplaced side chains or incorrect hydrogen-bonding networks.
- Insensitivity to Specific Interactions: RMSD does not directly report on the quality of key molecular interactions, like hydrogen bonds or salt bridges, which are often crucial for function.
- Alignment Dependence: The calculation is sensitive to the structural alignment procedure, and different choices can lead to different RMSD values for the same conformational pair.
- Poor Indicator for Disordered Systems: For intrinsically disordered proteins (IDPs) or flexible regions, RMSD is often high and not a meaningful measure of force field quality [71].
Relying solely on RMSD is a classic symptom of sampling limitations in research, where computational convenience is prioritized over a physically nuanced understanding.
The Principle of Multi-Metric Validation
Multi-metric validation argues that no single metric can capture the full complexity of a biomolecular system's potential energy surface. Instead, a collection of complementary metrics provides a robust assessment by cross-validating different aspects of structural and dynamic integrity [70]. This approach is essential because force fields are highly parametrized, and improvements in one property (e.g., reproduction of J-coupling constants) can coincide with a loss of accuracy in another (e.g., radius of gyration) [70]. A multi-metric framework mitigates the risk of overfitting to a narrow set of observables and provides a more holistic view of force field performance.
The Multi-Metric Toolkit: Essential Validation Metrics
A robust validation protocol incorporates a range of metrics that probe global structure, local structure, and dynamics.
Quantitative Metrics for Validation
Table 1: Key Metrics for Multi-Metric Force Field Validation
| Metric Category | Specific Metric | What It Measures | Interpretation & Significance |
|---|---|---|---|
| Global Structure | Radius of Gyration (Rg) | Overall compactness and shape of the molecule [72]. | Useful for checking folding status and comparing against experimental data for IDPs [71]. |
| Solvent Accessible Surface Area (SASA) | Biomolecule's interaction with solvent; identifies buried/exposed regions [72]. | Helps assess hydrophobic collapse and solvation energy. | |
| Local Structure | Root-Mean-Square Fluctuation (RMSF) | Flexibility of specific residues or atoms [72]. | Identifies rigid and flexible regions; can be compared to B-factors. |
| Hydrogen Bond Count | Number of stable backbone and side-chain hydrogen bonds [70]. | Crucial for assessing secondary structure stability. | |
| ϕ and ψ Dihedral Angle Distribution | Population of rotameric states in the Ramachandran plot [70]. | Assesses the accuracy of the torsional potential and allowed conformations. | |
| Experimental Observables | J-Coupling Constants | Measurements related to torsional angles [70]. | Provides direct experimental comparison for local geometry. |
| Nuclear Overhauser Effect (NOE) Intensities | Interatomic distances, particularly in NMR structure validation [70]. | Offers experimental restraints for validating contact distances. | |
| Residual Dipolar Couplings (RDCs) | Orientational restraints from NMR [70]. | Sensitive to the global alignment and internal dynamics of the molecule. |
Research Reagent Solutions
Table 2: Essential Software and Analytical Tools
| Tool Name / Category | Primary Function | Key Application in Validation |
|---|---|---|
| Simulation Packages(GROMACS, AMBER, NAMD, CHARMM) | Running production MD simulations. | Generating the conformational ensemble for subsequent analysis [72]. |
| Analysis Suites(MDTraj, MDAnalysis, VMD) | Trajectory analysis and visualization. | Calculating metrics like RMSD, Rg, SASA, and hydrogen bonds from simulation data [72]. |
| Conformer Pruners(PRISM Pruner, CREGEN) | Screening and deduplicating conformational ensembles [73]. | Reducing computational cost before high-level refinement by removing redundant structures [73]. |
| NMR Back-Calculation Software | Predicting NMR observables from MD trajectories. | Calculating experimental observables (J-couplings, NOEs, RDCs) for direct validation [70]. |
| Force Field Validation Tools(Foyer) | Validating the syntax and structure of force field files [74]. | Ensuring force field files are well-formed and free of errors before simulations begin [74]. |
Experimental Protocols for Robust Validation
Protocol 1: Validating a Folded Protein Structure
Objective: To assess a force field's ability to maintain the native structure of a folded protein over a multi-nanosecond simulation.
- System Setup:
- Obtain an initial high-resolution structure (e.g., from the Protein Data Bank, PDB).
- Solvate the protein in a box of water molecules, ensuring a sufficient margin (e.g., 1.0 nm) from the protein to the box edge.
- Add ions to neutralize the system's charge and mimic physiological salt concentrations [72].
- Simulation Run:
- Perform energy minimization to remove steric clashes.
- Equilibrate the system first under NVT (constant Number of particles, Volume, and Temperature) and then under NPT (constant Number of particles, Pressure, and Temperature) ensembles to stabilize density [72].
- Run a production simulation for a duration sufficient to achieve stability in key metrics (e.g., RMSD, Rg).
- Multi-Metric Analysis:
- Calculate the RMSD of the protein backbone relative to the experimental structure to assess global stability.
- Compute the RMSF per residue to identify regions of abnormal flexibility or rigidity.
- Analyze the secondary structure content over time to check for unfolding or structural drift.
- Determine the number of native hydrogen bonds and compare it to the starting structure [70].
- Calculate the radius of gyration (Rg) and SASA to monitor overall compactness and solvation.
Protocol 2: Validating an Intrinsically Disordered Protein (IDP) Ensemble
Objective: To validate a force field's performance for an IDP, where the native state is a dynamic ensemble of conformations.
- System Setup:
- Start with an extended conformation or a coil structure, as there is no single native structure.
- Solvate and add ions as in Protocol 1. Special attention must be paid to the force field and water model, as some combinations artificially collapse IDPs [71].
- Simulation Run:
- Perform energy minimization and equilibration as before.
- Run multiple, independent replicas of the production simulation to improve sampling of the diverse conformational space.
- Multi-Metric Analysis:
- Calculate the radius of gyration (Rg) as a primary metric for chain dimensions [71] [72].
- Compute the SASA to probe solvation and exposure.
- Analyze J-coupling constants and chemical shifts for direct comparison with NMR experiments [70].
- Use Small-Angle X-ray Scattering (SAXS) to compute the theoretical scattering profile from the simulation ensemble and compare it directly with experimental SAXS data.
Workflow Visualization
Troubleshooting Guides & FAQs
Frequently Asked Questions (FAQs)
Q: My simulation has a low RMSD but poor performance on other metrics like hydrogen bonding or J-couplings. Is my force field valid?
- A: Not necessarily. A low RMSD indicates the overall fold is maintained but does not guarantee local structural accuracy. This discrepancy is a key reason to use multi-metric validation. You should investigate the local regions where hydrogen bonds are failing and consider if the force field accurately describes polar interactions and torsional potentials [70].
Q: How do I know if my simulation is long enough for meaningful validation?
- A: There is no universal answer, but convergence of key properties is a good indicator. Monitor metrics like RMSD, Rg, and potential energy over time. When these properties fluctuate around a stable average without a drift, your simulation may be sufficiently converged. Running multiple independent replicas helps confirm that your results are not due to limited sampling [70] [72].
Q: For my disordered protein, the force field produces an overly compact ensemble. What could be the cause?
- A: This is a known issue with some older force fields. The problem often lies in an imbalance between protein-water and water-water interactions, or insufficient treatment of long-range electrostatic interactions. Try using a modern force field specifically tuned for IDPs, and ensure you are using a sufficiently long interaction cutoff (e.g., 1.2 nm or more) to properly capture long-range effects [71].
Q: What is the biggest statistical pitfall in force field validation?
- A: The primary pitfall is drawing strong conclusions from a small number of proteins or short simulation times. Force field performance can be system-dependent, and properties may not be sufficiently converged in short runs. Always validate against a curated set of multiple proteins and use the longest, most statistically robust simulations feasible for your resources [70].
Common Problems and Solutions
Problem: High RMSD from the experimental starting structure.
- Checkpoints:
- Verify the system was properly equilibrated (temperature, pressure, density).
- Inspect the trajectory for localized unfolding or large conformational changes in flexible loops.
- Ensure the experimental structure is a valid reference (e.g., not crystal-packing artifacts).
- Solutions: Extend the equilibration phase, run replicates to see if the result is reproducible, or check if the force field is known to have issues with the specific protein class.
- Checkpoints:
Problem: The radius of gyration (Rg) does not match experimental data.
- Checkpoints:
- Confirm the experimental Rg value is accurate and obtained under similar conditions (e.g., temperature, pH).
- Check for insufficient sampling—the simulation may be trapped in a sub-state.
- Solutions: For IDPs, switch to a force field designed for disordered proteins. For folded proteins, running longer simulations or multiple replicas can help achieve a better-averaged ensemble [71].
- Checkpoints:
Problem: Poor agreement with NMR J-coupling constants.
- Checkpoints:
- Ensure the method for back-calculating J-couplings from the trajectory is sound.
- Check the dihedral angle distributions for the residues with poor agreement.
- Solutions: This often points to inaccuracies in the torsional potentials of the force field. While re-parametrization is a major undertaking, researchers can note this as a limitation or explore using a different force field variant [70].
- Checkpoints:
Problem: The simulation exhibits unphysical behavior, like local bond breaking.
- Checkpoints:
- Validate the force field file for errors using a tool like Foyer [74].
- Check the integrity of the topology and that all parameters are correctly assigned.
- Solutions: Re-run the energy minimization, use smaller integration time steps, and ensure all necessary bond constraints (e.g., SHAKE or LINCS) are correctly applied [72].
- Checkpoints:
In the realm of molecular dynamics (MD) simulations, empirical force fields describe the potential energy of a system, enabling the study of processes from peptide folding to the functional motions of large protein complexes at an atomic level. The quality of these force fields is paramount, as they form the very foundation upon which simulation results are built. While major force field families—AMBER, CHARMM, OPLS, and GROMOS—employ similar mathematical functions to represent atomic interactions, their parametrization strategies and performance characteristics vary significantly.
A persistent challenge in computational research is the poorly constrained nature of force field parametrization. Some properties are exquisitely sensitive to small parameter variations, while others appear quite insensitive. Furthermore, parameters within a given force field are highly correlated, meaning that alternative parameter combinations can yield similar results, and varying one parameter may render others suboptimal. This complexity is compounded by sampling limitations in validation studies. Historically, force field validation has been hampered by insufficient statistics, short simulation times, and a narrow range of benchmark proteins, making it difficult to draw statistically meaningful conclusions about their relative quality. This article establishes a technical support framework to help researchers navigate these challenges when working with modern force fields.
FAQ: Force Field Selection and Validation
Q1: What are the key challenges in validating force fields for molecular dynamics simulations?
Validating protein force fields presents several interconnected challenges:
- Poorly Constrained Parametrization: Force field parameters are highly correlated, and alternative parameter combinations can yield similar results for specific properties while varying in others [70].
- Choice of Target Properties: Parameters adjusted to reproduce conformational properties in one environment may fail in different conditions. There is no consensus on what data are most appropriate for validation [70].
- Experimental Data Uncertainties: Comparisons often use derived data (e.g., structural models) rather than direct experimental observations, introducing interpretation biases [70].
- Statistical Significance: Historically, validation studies have been limited by poor statistics, short simulation times, and few protein systems, making it difficult to reliably distinguish between force fields [70].
- Sampling Limitations: Comprehensive conformational sampling is particularly challenging for intrinsically disordered proteins (IDPs) that must efficiently cross energy barriers between local minima [75].
Q2: How do I choose the most appropriate force field for my specific system?
Force field performance can vary significantly depending on the system and properties of interest. Below is a comparative summary based on recent validation studies.
Table 1: Force Field Performance Across Different System Types
| Force Field | Protein Folding & Structure | Intrinsically Disordered Proteins | Membrane Systems | Solvation Free Energy |
|---|---|---|---|---|
| AMBER | Good performance with recent variants | Amberff99SB-ILDN tested for IDPs [75] | Not covered in results | GAFF: RMSE 3.3-3.6 kJ/mol [76] |
| CHARMM | Improved backbone ϕ, ψ sampling [77] | CHARMM22*/CHARMM36 best for conformational diversity [75] | CHARMM36 most suitable for liquid membranes [78] | CGenFF: RMSE ~4.0 kJ/mol [76] |
| OPLS | Historically comparable to others [70] | OPLS-AA/L bias toward random coil [75] | OPLS-AA overestimates density/viscosity [78] | OPLS-AA: RMSE 2.9 kJ/mol [76] |
| GROMOS | Validated on limited protein sets [70] | GROMOS96 bias toward hairpin structures [75] | Not covered in results | GROMOS-2016H66: RMSE 2.9 kJ/mol [76] |
For intrinsically disordered proteins like human amylin, studies combining enhanced sampling techniques (REST2) with force field testing reveal distinct structural biases:
- CHARMM22* shows the best ability to sample multiple conformational states consistent with experiments [75].
- GROMOS96 force fields exhibit conformational bias towards hairpin structures [75].
- CHARMM27 shows bias toward α-helices [75].
- OPLS-AA/L demonstrates bias toward random coil structures [75].
For liquid membrane systems containing ethers:
- CHARMM36 provides quite accurate density and viscosity values for diisopropyl ether and is most suitable for modeling ether-based liquid membranes [78].
- GAFF and OPLS-AA/CM1A overestimate DIPE density by 3-5% and viscosity by 60-130% [78].
- COMPASS also gives accurate density and viscosity but may be less transferable than CHARMM36 [78].
Q3: What experimental metrics are most valuable for force field validation?
A robust validation framework should consider multiple structural criteria rather than relying on a single metric. Statistically significant differences between force fields can be detected using these metrics, though improvements in one metric are often offset by losses in another [70].
Table 2: Key Validation Metrics and Their Significance
| Validation Metric | Description | Technical Considerations |
|---|---|---|
| Backbone Dihedral Angles | Distribution of ϕ and ψ angles | Sensitive to conformational preferences; CMAP corrections in CHARMM improve accuracy [77] |
| Hydrogen Bonding | Number of backbone and native hydrogen bonds | Inductive of structural stability |
| Solvent-Accessible Surface Area | Polar and nonpolar SASA | Related to solvation energy and hydrophobic effects |
| Radius of Gyration | Measure of compactness | Particularly important for IDPs and unfolded states |
| Secondary Structure | Prevalence of α-helices, β-sheets | Shows structural biases; CHARMM22* rebalanced α-helix/extended equilibrium [77] |
| NMR Observables | J-couplings, NOEs, RDCs | Direct experimental comparators; but back-calculation requires careful motional modeling [70] |
| Root-Mean-Square Deviation | Positional deviation from experimental structures | Commonly used but can be misleading without sufficient sampling [70] |
| Solvation Free Energy | Transfer free energies between phases | Thermodynamic property important for solution behavior [76] |
Q4: What advanced sampling methods help overcome sampling limitations?
Enhanced sampling techniques are crucial, particularly for systems with complex energy landscapes:
- Replica Exchange with Solute Tempering (REST2): A Hamiltonian replica exchange method that applies energy increases only to part of the system (the solute), making it more computationally efficient than temperature-based replica exchange methods while maintaining unbiased sampling [75].
- Temperature Replica Exchange MD (T-REMD): Simulates multiple replicas at different temperatures, allowing higher-temperature replicas to cross energy barriers while lower-temperature ones sample broader conformational space [75].
- Bias-Exchange Metadynamics (BEMD): Uses history-dependent biases to overcome free-energy barriers, but requires careful selection of collective variables to avoid systematic biases [75].
For the amylin system, REST2 yielded results qualitatively consistent with experiments and in quantitative agreement with other sampling methods, but with greater computational efficiency and without bias [75].
Troubleshooting Guides
Issue 1: Inconsistent Force Field Behavior Across Different Systems
Problem: A force field performs well for one protein system but poorly for another, or shows conflicting results for different validation metrics.
Solution Approach:
- Expand Validation Set: Use a diverse set of proteins/peptides rather than a single system. Studies using 52 high-resolution structures provide more statistically significant comparisons [70].
- Multi-Metric Assessment: Evaluate against a range of structural criteria rather than a single property. Improvements in one metric are often offset by losses in another [70].
- Consider System-Specific Factors: Account for differences between folded proteins, membrane-bound peptides, and intrinsically disordered proteins, as force field performance may vary across these contexts [75].
Issue 2: Inadequate Sampling of Conformational Space
Problem: The simulation fails to sufficiently sample relevant conformational states, particularly for systems with high energy barriers or disordered regions.
Solution Approach:
- Implement Enhanced Sampling: For IDPs like amylin, combine force field testing with advanced sampling methods like REST2, which provides efficient, unbiased sampling [75].
- Extend Simulation Time: When possible, use longer simulation times and multiple replicates to improve statistical significance [70].
- Validate with Multiple Starting Structures: Use both folded and unfolded starting conformations to test the force field's ability to sample transitions between states [75].
Issue 3: Software-Specific Force Field Implementation Problems
Problem: Technical issues with force field optimization in software packages, such as automatic reversion to default force fields.
Solution Approach:
- Check Element Compatibility: If optimization reverts to UFF (Universal Force Field), verify that all elements in your molecule are supported by your selected force field. MMFF94, for example, doesn't support less common elements [79].
- Software-Specific Settings: In packages like Avogadro, use the "Field Weights" settings to reduce influence of specific force fields to zero, or utilize "Effector Collection" to limit which force fields affect different system components [79].
- Software Updates: Consider updating to the latest software version, as force field implementation bugs may be resolved in newer releases [79].
Experimental Protocols for Force Field Validation
Protocol 1: Comprehensive Force Field Benchmarking
This protocol outlines a framework for systematic force field validation against experimental data, based on methodologies from recent literature [70] [76].
Materials and Setup:
- Test Set Selection: Curate a diverse set of high-resolution protein structures (e.g., 52 structures with 39 X-ray and 13 NMR-derived) [70].
- Force Fields for Comparison: Select multiple force fields from different families (AMBER, CHARMM, OPLS, GROMOS) [70] [76].
- Simulation Software: Use standard MD packages (GROMACS, NAMD, AMBER) with consistent settings across tests [75].
- Validation Metrics: Prepare calculations for multiple structural criteria (Table 2) [70].
Procedure:
- System Preparation:
Equilibration Protocol:
Production Simulation:
Data Analysis:
- Calculate all validation metrics (Table 2) consistently across force fields.
- Perform statistical testing to determine significance of differences.
- Compare with experimental data not used in force field parametrization.
Protocol 2: Solvation Free Energy Validation
This protocol specifically validates force fields against experimental solvation properties, important for simulating solution behavior [76].
Materials:
- Test Molecules: Select 25 small molecules representative of various chemical groups (alkanes, chloroalkanes, ethers, ketones, esters, alcohols, amines, amides) [76].
- Force Fields: Include condensed-phase force fields from major families (GROMOS-2016H66, OPLS-AA, AMBER-GAFF, CHARMM-CGenFF, etc.) [76].
- Experimental Data: Reference matrix of N × N cross-solvation free energies [76].
Procedure:
- Setup: For each solute-solvent combination, prepare systems with standardized box sizes and molecule counts.
- Simulation: Use free energy calculation methods (thermodynamic integration or free energy perturbation).
- Analysis: Calculate root-mean-square errors (RMSE) and correlation coefficients between experimental and simulation results.
- Comparison: Rank force fields by accuracy in reproducing experimental solvation free energies.
The Scientist's Toolkit: Essential Research Reagents and Materials
Table 3: Key Research Reagents and Computational Tools for Force Field Studies
| Item | Function/Description | Example Applications |
|---|---|---|
| GROMACS | Molecular dynamics package | Simulation execution and analysis [75] |
| AMBER | Suite of biomolecular simulation programs | Force field development and testing [70] |
| CHARMM | Program for macromolecular dynamics | All-atom simulation of proteins [77] |
| TIP3P Water Model | Transferable intermolecular potential water | Default for many CHARMM/AMBER simulations [75] |
| SPC Water Model | Simple point charge water model | Used with GROMOS force fields [75] |
| REST2 Implementation | Replica exchange with solute tempering | Enhanced sampling for IDPs [75] |
| Particle Mesh Ewald | Electrostatic interaction treatment | Accurate long-range electrostatics [70] |
| Cross-Solvation Database | Experimental solvation free energies | Force field validation [76] |
The comparative analysis of modern force fields reveals that while statistically significant differences exist between parameter sets, these differences are often not pronounced, and improvements in one property may come at the expense of another. The choice of force field should therefore be guided by the specific system under investigation and the properties of interest, rather than seeking a universally superior option.
Future force field development should prioritize:
- Comprehensive Validation Frameworks: Using large, diverse test sets and multiple validation metrics to avoid overfitting to specific systems or properties [70].
- Enhanced Sampling Integration: Combining rigorous force field testing with advanced sampling methods, particularly for challenging systems like IDPs [75].
- Direct Experimental Comparison: Where possible, using direct experimental observables rather than derived data for validation [70].
By adopting these systematic approaches and utilizing the troubleshooting guidance provided, researchers can make more informed decisions in force field selection and implementation, ultimately enhancing the reliability of molecular dynamics simulations in academic and industrial research.
Leveraging NMR, SAXS, and Thermodynamic Data for Ensemble Validation
FAQs on Data Integration and Ensemble Validation
FAQ 1: What is the core principle behind integrative modeling for IDP conformational ensembles? Integrative modeling combines experimental data from multiple biophysical techniques to build a detailed structural model of fluctuating, heterogeneous systems like Intrinsically Disordered Proteins (IDPs). Since no single method can fully capture the ensemble, data from Nuclear Magnetic Resonance (NMR), Small-angle X-ray Scattering (SAXS), and single-molecule Förster Resonance Energy Transfer (smFRET) are used together to apply conformational restraints. The resulting ensemble is then rigorously validated against independent experimental data to ensure it represents a consistent and accurate structural picture [80].
FAQ 2: Why is independent validation, for instance with smFRET data, so critical in this process? Using a technique like smFRET for independent validation, rather than incorporating it directly into the model building, provides an unbiased test of the ensemble's accuracy. Successfully predicting smFRET measurements that were not used to generate the ensemble greatly increases confidence that the model is correct and not over-fitted. It also helps verify that potential perturbations, such as those from NMR or smFRET labels, have minimal impact on the protein's native conformational distribution [80].
FAQ 3: What are common force field limitations that affect conformational sampling in MD simulations? Molecular mechanics force fields, while powerful, have several known limitations that impact sampling and validation:
- Inaccurate Electrostatics and Solvation: They can suffer from undersolvation of neutral residues (e.g., histidines) and overstabilization of salt bridges, leading to errors in pKa predictions and, consequently, protonation-dependent conformational states [39].
- Lack of Chemical Reactivity: They cannot model bond breaking and formation, limiting the study of chemical reactions [43].
- Parameterization Challenges: Accuracy is highly dependent on the quality of the force field and its parameters, which may not transfer well to all molecular systems. The choice of water model also significantly influences the outcome [39] [43].
FAQ 4: How can sampling bias be mitigated in computational experiments? Sampling bias, a systematic error from a non-random sample, can be minimized through specific strategies:
- Enhanced Sampling Techniques: Methods like replica-exchange molecular dynamics accelerate conformational sampling and help simulations escape local energy minima, leading to a more thorough exploration of the free energy landscape [39] [43].
- Stratified Random Sampling: In a data analysis context, this ensures your sample is accurately representative of the entire population you intend to study, preventing over- or under-representation of certain groups [81].
- Cross-Validation: In machine learning model validation, techniques like k-Fold Cross-Validation minimize sampling bias by ensuring all observations are used for both training and testing, providing a more reliable estimate of model performance [82].
Troubleshooting Guides
Troubleshooting Discrepancies Between SAXS and smFRET Inferences
Problem: A generated conformational ensemble fits SAXS data but is inconsistent with independent smFRET measurements.
| Possible Cause | Diagnostic Steps | Solution |
|---|---|---|
| Inadequate Ensemble Diversity | Check if the ensemble shows insufficient conformational heterogeneity. Analyze the radius of gyration (Rg) distribution and end-to-end distance fluctuations [80]. | Integrate SAXS data with NMR-derived restraints to better capture local and global dynamics. Reserve smFRET data for validation only [80]. |
| Systematic Error in Data Processing | Verify SAXS data quality. Ensure sample is monodisperse; use inline size-exclusion chromatography (SEC-SAXS) if needed [83]. | Use tools like DATASW for robust HPLC-SAXS data analysis and averaging to ensure data represents a pure, folded state [83]. |
| Force Field Inaccuracy | Compare pKa values of key residues from simulation with experimental values. Look for errors in buried residues or salt bridges [39]. | Switch to a more modern force field (e.g., Amber ff19sb over ff14sb) with an accurate water model (e.g., OPC). Consider using polarizable force fields or specific Lennard-Jones corrections (NBFIX) [39]. |
Troubleshooting Force Field Validation in Constant pH Simulations
Problem: Constant pH molecular dynamics simulations show large errors in pKa values for buried residues or those in salt bridges.
| Possible Cause | Diagnostic Steps | Solution |
|---|---|---|
| Undersolvation of Neutral Species | Analyze the solvent-accessible surface area (SASA) of the problematic residue in its neutral state [39]. | Consider using a polarizable force field or a force field with specific corrections (NBFIX) to improve the description of solvation and electrostatic interactions [39] [20]. |
| Over-stabilization of Salt Bridges | Measure the distance and interaction energy between the titratable residue and its salt bridge partner. Compare with known structural data [39]. | The use of atom-pair specific Lennard-Jones corrections (NBFIX) can partially alleviate over-stabilization. Benchmark against a higher-level theory or experimental data [39]. |
| Inadequate Conformational Sampling | Perform multiple independent simulations and check for convergence of pKa values and key structural metrics [39]. | Employ enhanced sampling techniques, such as replica-exchange titration, to improve conformational sampling and ensure proper convergence of protonation states [39]. |
Experimental Protocols
Protocol: Integrative Ensemble Modeling with NMR, SAXS, and smFRET
Objective: To generate and validate a conformational ensemble of an intrinsically disordered protein (IDP) that is consistent with NMR, SAXS, and smFRET data.
Workflow Description: This protocol outlines an integrative approach for determining the conformational ensemble of an Intrinsically Disordered Protein (IDP). The process begins with parallel experimental data collection using NMR, SAXS, and smFRET on the same protein sample. The key step is integrative modeling, where data from NMR and SAXS are combined to generate a preliminary conformational ensemble. This ensemble is then critically tested against the smFRET data, which was withheld from the model-building process. If the ensemble successfully predicts the independent smFRET data, it is considered validated. If not, the model must be refined and the process iterated until consistency across all data sources is achieved [80].
Steps:
- Sample Preparation: Produce and purify the IDP. For SAXS, ensure sample monodispersity, potentially using inline SEC (Size Exclusion Chromatography).
- NMR Data Collection: Perform standard NMR experiments to obtain chemical shifts, residual dipolar couplings (RDCs), and other parameters that provide information on local structure and dynamics.
- SAXS Data Collection: Collect scattering data. Use tools like DATASW for data processing and averaging, especially if using an HPLC-SAXS setup, to obtain parameters like the radius of gyration (Rg) and the pair-distance distribution function [83].
- smFRET Data Collection: Perform single-molecule FRET experiments to obtain information on end-to-end distances and their fluctuations within the ensemble.
- Integrative Modeling: Input the experimental restraints from NMR and SAXS into a computational modeling software package to generate a pool of possible conformations that collectively satisfy the input data.
- Ensemble Validation: Compare the calculated FRET efficiency or distance distributions from the generated ensemble directly against the experimental smFRET data. Agreement suggests a highly confident ensemble [80].
Protocol: Validating Force Fields with Constant pH MD
Objective: To assess the accuracy of a molecular mechanics force field by calculating pKa values of titratable residues in a protein and comparing them to experimental values.
Workflow Description: This protocol uses constant pH molecular dynamics (CpHMD) simulations to probe the limitations of a protein force field. The pKa value of a residue is highly sensitive to its local electrostatic environment and desolvation energy, making it an excellent metric for force field validation. The process involves running replica-exchange CpHMD simulations across a wide pH range for a benchmark protein like BBL. The calculated pKa values from the simulation are then compared to experimental values. Significant deviations, especially for buried residues or those in salt bridges, indicate deficiencies in the force field's description of electrostatics or solvation [39].
Steps:
- System Preparation: Obtain a protein structure (e.g., from the PDB). Add missing atoms, cap termini, and add dummy hydrogens to titratable sites. Solvate the protein in a water box and add ions to neutralize the system and match physiological ionic strength [39].
- Force Field Selection: Choose the protein force field (e.g., Amber ff19sb, CHARMM c36m) and water model (e.g., OPC, TIP3P). Note that the choice significantly impacts results [39].
- Equilibration: Perform energy minimization, heating, and equilibration of the system under the desired thermodynamic ensemble (NPT or NVT).
- Production Simulation: Run all-atom, continuous constant pH MD simulations using a particle mesh Ewald (PME) method. Employ a replica-exchange (REX) protocol over a range of pH values (e.g., 16 replicas from pH 1.0 to 8.5) to enhance sampling of protonation states and conformations [39].
- pKa Calculation: Discard the initial equilibration period and calculate the pKa of each titratable residue from the simulation data using the fraction of time the residue spends in its protonated state.
- Validation: Compare the calculated pKa shifts (ΔpKa) relative to model compound values with experimentally determined ΔpKa values. A large root-mean-square error (RMSE) suggests underlying force field inaccuracies [39].
Research Reagent Solutions
Table 1: Key Software and Computational Tools
| Item Name | Function/Brief Explanation | Relevant Technique |
|---|---|---|
| DATASW | A program for processing and analyzing HPLC-SAXS data. It performs frame averaging and calculates overall parameters (I(0), Rg, Dmax) [83]. | SAXS |
| Utah SAXS Tools | A collection of Python-based programs and ImageJ macros for processing, analyzing, and plotting SAXS and SANS data, particularly from line-collimated cameras [84]. | SAXS |
| PME Continuous CpHMD | An all-atom molecular dynamics method that allows protonation states to respond to pH and conformational changes during the simulation, used for calculating pKa values [39]. | MD Simulation |
| Replica-Exchange MD | An enhanced sampling technique that runs multiple simulations (replicas) at different temperatures or pH conditions, periodically exchanging information between them to improve conformational sampling [39]. | MD Simulation |
| NBFIX | Atom-pair specific corrections to the non-bonded Lennard-Jones parameters in a force field. Used to fix inaccuracies in interactions like over-stabilized salt bridges [39]. | Force Field |
Table 2: Key Experimental Techniques and Materials
| Item Name | Function/Brief Explanation | Relevant Technique |
|---|---|---|
| SEC-SAXS | Size-Exclusion Chromatography coupled inline with SAXS. Essential for profiling heterogeneous samples and ensuring data is collected on a monodisperse sample [83]. | SAXS |
| smFRET Labels | Fluorescent dye pairs (donor and acceptor) attached to the protein for measuring distances and dynamics via Förster Resonance Energy Transfer at the single-molecule level [80]. | smFRET |
| BBL Mini-Protein | A well-characterized model protein often used as a benchmark for testing and validating new computational methods, including constant pH MD and force fields [39]. | Validation |
| Polarizable Force Fields | A class of advanced force fields that allow for changes in atomic charge distribution in response to the environment, offering improved accuracy over fixed-charge force fields [43] [20]. | MD Simulation |
Statistical Significance Testing in Force Field Performance Evaluation
Frequently Asked Questions (FAQs)
Q1: What is the primary role of statistical significance testing in force field validation? Statistical significance testing in force field validation provides a framework to determine whether observed differences between simulation results and experimental reference data (or between different force fields) are likely due to true methodological differences or random sampling variation. This is particularly crucial when dealing with finite simulation times and limited experimental data, both of which introduce sampling limitations that can affect the reliability of your conclusions. Proper statistical testing helps researchers distinguish meaningful force field improvements from random fluctuations [85].
Q2: Why is the standard p < 0.05 threshold potentially problematic for force field evaluation? The conventional p < 0.05 threshold has been debated because it can lead to a high false discovery rate, especially when multiple properties or systems are tested simultaneously [85]. Some fields like genomics have adopted more stringent thresholds to account for multiple testing, and similar considerations may apply to force field validation where numerous molecular properties are often assessed [85]. The American Statistical Association warns against using p-values as the sole basis for conclusions, emphasizing they don't measure effect size or practical importance [85].
Q3: How should I handle multiple testing when evaluating multiple molecular properties? When evaluating force fields across multiple molecular properties (e.g., density, free energy, conformational preferences), you should apply corrections for multiple testing to control the family-wise error rate. Common approaches include the Bonferroni correction (more conservative) or the Benjamini-Hochberg procedure (controls false discovery rate). The specific approach should be predetermined in your analysis plan to avoid inflated Type I errors [85].
Q4: What are the best practices for reporting p-values in force field studies? Always report exact p-values rather than just stating "p < 0.05" or "p > 0.05" to provide a continuous measure of evidence against the null hypothesis [85]. Additionally, report effect sizes and confidence intervals alongside p-values to give readers information about the magnitude and precision of observed effects, which is often more informative for force field selection than statistical significance alone [85].
Q5: How can I determine the appropriate sample size or simulation length for adequate statistical power? Power analysis conducted before running simulations can help determine the sampling required to detect meaningful effects. For molecular simulations, this involves preliminary studies to estimate variance in your observables of interest. The required sample size depends on the effect size you want to detect, the natural variability of the property, and your chosen alpha and beta error rates. Longer simulation times and multiple independent replicas improve power to detect small but physically meaningful differences [86].
Troubleshooting Common Experimental Issues
Problem: Inconsistent Results Across Different Simulation Packages
Symptoms: The same force field produces statistically different results when implemented in different molecular dynamics software packages.
Diagnosis and Resolution:
- Check parameter implementation: Verify that all functional forms, combining rules, and numerical constants are identical across implementations. Small differences in handling long-range electrostatics or constraints can significantly affect results.
- Validate integration algorithms: Ensure similar integrators and time steps are used, as different numerical integration methods can introduce systematic variations.
- Control simulation conditions: Confirm identical thermodynamic ensembles, temperature and pressure coupling schemes, and boundary conditions.
- Run longer equilibration: Extend equilibration periods to ensure systems reach the same thermodynamic state regardless of initial conditions or software-specific implementations.
Problem: Poor Statistical Power Despite Long Simulation Times
Symptoms: Even with extensive sampling, statistical tests fail to detect differences that are believed to be physically meaningful.
Diagnosis and Resolution:
- Increase replica count: Running multiple independent simulations (replicas) often provides better statistical power than single long simulations for estimating certain properties.
- Use variance reduction techniques: Implement methods like stratified sampling or control variates to reduce statistical uncertainty in your observables.
- Focus on high-precision observables: Identify which thermodynamic or structural properties your force field can predict with the lowest inherent variance for more sensitive statistical comparisons.
- Re-evaluate effect size: The difference you're trying to detect might be smaller than the natural fluctuations of the system, requiring even more extensive sampling.
Problem: Discrepancy Between Statistical and Practical Significance
Symptoms: Statistically significant differences (p < 0.05) are found between force fields, but the magnitude of difference is physically meaningless.
Diagnosis and Resolution:
- Calculate effect sizes: Always compute and report effect sizes (e.g., Cohen's d for mean differences) alongside p-values to contextualize the practical importance of differences [85].
- Define meaningful difference thresholds: Before analysis, establish what magnitude of difference matters for your specific application (e.g., >1% difference in density might be meaningful for some applications but not others).
- Use equivalence testing: When trying to demonstrate that two force fields perform similarly, consider equivalence testing with pre-defined equivalence bounds rather than traditional significance tests.
Experimental Protocols for Key Validation Experiments
Protocol 1: Density Calculation for Liquid Systems
Objective: Determine the equilibrium density of a liquid system with statistical uncertainty quantification.
Materials:
- Simulation Software: GROMACS, AMBER, OpenMM, or NAMD
- Force Field Parameters: The specific force field being evaluated
- Initial Configuration: Energy-minimized structure of ~100-1000 molecules
- Computational Resources: Adequate CPU/GPU resources for nanosecond-scale simulation
Procedure:
- Energy Minimization: Minimize the initial configuration using steepest descent or conjugate gradient algorithm until maximum force < 1000 kJ/mol/nm.
- NVT Equilibration: Run simulation in canonical ensemble (constant NVT) for 100-500 ps using appropriate temperature coupling.
- NPT Production: Switch to isothermal-isobaric ensemble (constant NPT) for 2-20 ns, using pressure coupling appropriate for your force field.
- Data Collection: Record density values every 100-1000 steps during production phase.
- Statistical Analysis: Discard initial equilibration period (first 10-20% of production), then calculate mean, standard deviation, and standard error of the mean.
Statistical Analysis:
Protocol 2: Free Energy Calculation Using Thermodynamic Integration
Objective: Calculate free energy differences with rigorous error estimation.
Materials:
- Coupling Parameters: Set of λ values for alchemical transformation (typically 11-21 points)
- Enhanced Sampling Capability: Software supporting Hamiltonian exchange or replica exchange
- Convergence Monitoring Tools: Methods to assess decorrelation and statistical inefficiency
Procedure:
- λ Schedule Design: Create a set of λ values (more points where ∂H/∂λ changes rapidly).
- Window Equilibration: For each λ, run equilibration until observable properties stabilize.
- Production Sampling: Run sufficient sampling at each λ window, recording ∂H/∂λ.
- Error Estimation: Use block averaging or bootstrap methods to estimate statistical uncertainty.
- Integration: Perform numerical integration (e.g., Bennett's method or MBAR) to compute ΔG.
Statistical Considerations:
- Use overlapping sampling distributions to identify inadequate sampling
- Apply autocorrelation analysis to determine statistical inefficiency
- Report confidence intervals from bootstrapping or error propagation
Protocol 3: Conformational Equilibrium Validation
Objective: Validate force field performance in reproducing conformational populations of biomolecules.
Materials:
- Reference Data: Experimental NMR data, crystallographic B-factors, or spectroscopic data
- Enhanced Sampling Methods: Replica exchange, metadynamics, or accelerated MD if needed
- Analysis Tools: Clustering algorithms, dihedral angle analysis, and Markov state modeling
Procedure:
- Extended Sampling: Run sufficient simulation time to sample relevant conformational states.
- State Identification: Use clustering or state assignment algorithms to identify metastable states.
- Population Calculation: Compute relative state populations from simulation trajectories.
- Statistical Comparison: Use appropriate statistical tests (e.g., χ²) to compare with experimental reference data.
Quantitative Data Presentation
Table 1: Statistical Power Considerations for Common Force Field Validation Metrics
| Validation Metric | Typical Sampling Requirements | Recommended Statistical Test | Effect Size Threshold | Common Pitfalls |
|---|---|---|---|---|
| Density | 10-20 ns production after equilibration | One-sample t-test vs experimental value | >1% difference from experimental | Inadequate pressure equilibration, poor system preparation |
| Free Energy of Solvation | 5-10 ns per λ window with 11-21 windows | Two-sample t-test between force fields | >0.5 kcal/mol difference | Inadequate λ spacing, poor ∂H/∂λ convergence |
| RMSD of Protein Structures | 100+ ns for small proteins, µs for larger | Kolmogorov-Smirnov test for distribution differences | >0.1 Å mean difference | Comparing to single crystal structure ignoring natural flexibility |
| Dihedral Angle Distributions | Sufficient to observe multiple transitions | χ² test for distribution differences | >10% population difference | Inadequate sampling of rare transitions, comparing to biased experimental ensembles |
| Diffusion Coefficients | 10-100 ns depending on system size | F-test for variance equality before t-test | >20% difference | Anisotropic diffusion, insufficient sampling for mean-squared displacement linearity |
Table 2: Statistical Significance Thresholds for Different Validation Contexts
| Validation Context | Recommended Alpha Level | Multiple Testing Correction | Minimum Independent Observations | Notes |
|---|---|---|---|---|
| Single Property Comparison | 0.05 | None required | 3+ independent replicas | Standard threshold for preliminary studies |
| Multiple Property Screening | 0.01 | Bonferroni or FDR control | 5+ independent replicas | Conservative threshold to avoid false discoveries |
| Force Field Parameterization | 0.005 | Strict family-wise error control | 10+ diverse molecules | Very conservative for parameter development [85] |
| Clinical/Pharmaceutical Applications | 0.005 | Bayesian methods recommended | System-dependent | Highest evidence threshold for decision-making [85] |
| Methodological Development | 0.05 | Report effect sizes and CIs | Focus on practical significance | Balance between discovery and validation |
Research Reagent Solutions
Table 3: Essential Computational Tools for Force Field Validation
| Tool Name | Function | Application Notes |
|---|---|---|
| gmx_MMPBSA | Free energy calculations | Integrates with GROMACS, good for protein-ligand binding affinities |
| MDAnalysis | Trajectory analysis | Python-based, extensive analysis toolkit for structural properties |
| ALPHA | Statistical error analysis | Specialized for estimating uncertainties in correlated data |
| Simulation Length Estimators | Power analysis | Help determine required simulation time for target statistical power |
| Bootstrap Resampling Codes | Uncertainty quantification | Non-parametric error estimation for complex observables |
| MBAR | Free energy analysis | Multistate Bennett Acceptance Ratio for optimal free energy estimation |
| VMD | Visualization and analysis | Essential for qualitative assessment and trajectory visualization |
| Packmol | System building | Initial configuration generation for molecular systems [87] |
| Polyply | Polymer structure generation | Specialized for building polymer initial configurations [87] |
Benchmarking Protocols for Transferable Validation Standards
Frequently Asked Questions: Force Field Validation
FAQ 1: My MD simulations are crashing or becoming unstable. What could be the cause? Simulation failures often stem from two primary issues related to force field limitations. First, structural instabilities can generate unphysically large forces (e.g., >100 eV/Å), making integration computationally prohibitive. Second, memory overflow can occur when unstable structures create excessive edges in graph-based force field representations. These failures are often intrinsic model limitations, not resolvable by simply increasing computational resources. To troubleshoot, verify that your system's chemical complexity (element diversity, number of atoms) is well-represented in the force field's training data, as models can fail silently without clear warning signs [88].
FAQ 2: How can I ensure my force field performs well for both structured and disordered proteins? Achieving a balance for hybrid protein systems is a known challenge. The choice of water model is critical. The TIP3P model, for example, can cause an artificial structural collapse in disordered regions, while the TIP4P-D model significantly improves reliability. Furthermore, no single force field may optimally capture both well-structured domains and disordered regions. It is essential to benchmark against NMR parameters (such as relaxation rates, residual dipolar couplings, and chemical shifts) in addition to structural data, as these are highly sensitive to dynamics and can reveal force field deficiencies that structural metrics alone might miss [89].
FAQ 3: Why does my force field, accurate on computational benchmarks, perform poorly against experimental data? This "reality gap" arises because standard computational benchmarks are often trained and tested on similar DFT-generated data, creating a circular evaluation that may not capture real-world experimental complexity. To close this gap, validate against experimental properties like density, solvation free energy, and enthalpy of mixing. Performance errors often correlate more strongly with how well your specific chemical environment is represented in the force field's training data than with the underlying model architecture itself [88] [90] [91].
FAQ 4: How do I quantify uncertainty and assess sampling quality in my simulations? A robust uncertainty quantification (UQ) protocol is essential. Begin by distinguishing between your raw data (the direct output from the simulation) and derived observables (quantities calculated from non-trivial analysis). Use the experimental standard deviation of the mean to estimate the standard uncertainty in your reported averages. Crucially, account for correlation time in your time-series data; using all data points without considering correlations will lead to an underestimation of the true uncertainty. Always report the methods and assumptions used in your UQ analysis [1].
Quantitative Performance Benchmarks
Table 1: Performance of Universal ML Force Fields on Experimental Mineral Structures (UniFFBench) [88]
| Force Field Model | MD Completion Rate (MinX-EQ) | MD Completion Rate (MinX-POcc) | Density Prediction MAPE | Lattice Parameter MAPE |
|---|---|---|---|---|
| Orb | ~100% | ~100% | <10% | <10% |
| MatterSim | ~100% | ~100% | <10% | <10% |
| SevenNet | ~95% | ~75% | <10% | <10% |
| MACE | ~95% | ~75% | <10% | <10% |
| CHGNet | <15% | <15% | N/A | N/A |
| M3GNet | <15% | <15% | N/A | N/A |
Table 2: Performance of Protein Force Fields in Binding Free Energy Calculations (Front. Mol. Biosci. 2022) [24]
| Parameter Set | Protein Forcefield | Water Model | Charge Model | Binding Affinity MUE (kcal/mol) |
|---|---|---|---|---|
| Set 1 | AMBER ff14SB | SPC/E | AM1-BCC | 0.89 |
| Set 2 | AMBER ff14SB | TIP3P | AM1-BCC | 0.82 |
| Set 4 | AMBER ff15ipq | SPC/E | AM1-BCC | 0.85 |
| Set 5 | AMBER ff14SB | TIP3P | RESP | 1.03 |
| FEP+ Reference | OPLS2.1 | - | - | 0.77 |
Table 3: Key Reagents and Computational Tools for Force Field Validation
| Research Reagent / Tool | Type | Primary Function in Validation |
|---|---|---|
| UniFFBench Framework [88] | Benchmarking Framework | Provides a standardized dataset (MinX: ~1,500 minerals) and protocol for evaluating force fields against experimental measurements. |
| OpenFF Sage 2.0.0 [90] | Small Molecule Force Field | A force field trained on quantum chemical data and condensed-phase physical properties for drug-like molecules. |
| ForceBalance [44] | Parameter Fitting Tool | Enables automated, reproducible optimization of force field parameters against experimental and quantum mechanical target data. |
| QUBEKit [44] | Force Field Derivation Toolkit | Generates bespoke force field parameters directly from quantum mechanical calculations via a QM-to-MM mapping workflow. |
| TIP4P-D Water Model [89] | Water Model | An explicitly solvated environment model that improves reliability for simulations containing intrinsically disordered protein regions. |
Detailed Experimental Protocols
Protocol 1: Validating Against Condensed Phase Experimental Data
This protocol is based on the methodology used to develop and validate the OpenFF Sage 2.0.0 force field [90].
Training Data Curation:
- Collect a broad set of experimental physical properties from databases like the NIST ThermoML Archive. Prioritize data for binary mixtures, as they better capture interactions between unlike molecules compared to pure liquid properties.
- Key target properties include: densities (ρ) and enthalpies of mixing (ΔHmix) for various compositions.
- Include aqueous system properties to ensure self-consistency with the chosen water model (e.g., TIP3P).
Parameter Optimization Workflow:
- Stage 1 - Lennard-Jones (LJ) Refit: Using a fixed set of valence parameters, refit select LJ parameters against the experimental condensed-phase physical properties to create an initial "vdw-v1" force field.
- Stage 2 - Valence Refit: With the LJ parameters fixed, refit the valence parameters (bonds, angles, torsions) against a large database of quantum chemical calculations.
- Stage 3 - Validation: The resulting force field (e.g., Sage) must be validated against a separate set of QM data, physical properties, and, if applicable, protein-ligand binding data not used in training.
Protocol 2: Assessing Force Fields for Hybrid Ordered/Disordered Proteins
This protocol outlines a sensitive benchmarking strategy for proteins containing both structured domains and disordered regions [89].
System Preparation:
- Select one or more hybrid proteins with well-characterized structured domains and disordered regions with known transient helical propensities.
- Solvate the protein in a rhombic dodecahedral box with a minimal distance of 2 nm between the solute and box walls.
- Neutralize the system's charge and adjust the salt concentration to a physiologically relevant level (e.g., 100 mM).
Simulation and Analysis:
- Run molecular dynamics simulations (microsecond timescale) using different force field and water model combinations (e.g., CHARMM36m with TIP4P-D, Amber99SB-ILDN with TIP3P).
- From the resulting trajectories, predict a suite of experimentally measurable observables:
- Structural Properties: Radius of gyration (from SAXS data).
- NMR Parameters: Chemical shifts, residual dipolar couplings (RDCs), and paramagnetic relaxation enhancement (PRE).
- Dynamics Data: NMR relaxation parameters (R1, R2, and ssNOE), which are highly sensitive to force field inaccuracies.
- Compare all predicted quantities directly with experimental data. A force field that reliably reproduces this diverse set of experimental readouts, especially the NMR relaxation parameters, is considered more robust for simulating hybrid protein systems.
Workflow Visualization
Force Field Validation Workflow
Validation Data and Scope
Conclusion
The reliable validation of molecular force fields demands a multifaceted approach that acknowledges the intrinsic limitations of sampling in complex biomolecular systems. By integrating advanced sampling methodologies, robust multi-metric validation against diverse experimental data, and emerging AI-enhanced techniques, researchers can significantly improve the predictive power of molecular simulations. Future directions must focus on developing more efficient sampling algorithms, force fields with better transferability across different molecular classes, and standardized benchmarking protocols that encompass the full complexity of biological systems. These advances will be crucial for accelerating drug discovery, particularly for challenging targets like GPCRs and RNA-based therapeutics, where accurate simulation of molecular recognition is paramount. The integration of physical models with data-driven approaches represents the most promising path toward achieving both computational efficiency and biological relevance in force field development and application.
References
- 1. Best Practices for Quantification of Uncertainty and Sampling ... [https://pmc.ncbi.nlm.nih.gov/articles/PMC6286151/]
- 2. The combined force field-sampling problem in simulations of ... [https://pmc.ncbi.nlm.nih.gov/articles/PMC6417907/]
- 3. Assessing the effect of forcefield parameter sets on ... [https://www.frontiersin.org/journals/molecular-biosciences/articles/10.3389/fmolb.2022.972162/full]
- 4. Differentiable simulation to develop molecular dynamics force ... [https://pubs.rsc.org/en/content/articlehtml/2024/sc/d3sc05230c]
- 5. Systematic Validation of Protein Force Fields against ... [https://journals.plos.org/plosone/article?id=10.1371/journal.pone.0032131]
- 6. Systematic Validation of Protein Force Fields against ... [https://pmc.ncbi.nlm.nih.gov/articles/PMC3285199/]
- 7. Success and Limitations of Current Force Fields for the ... [https://pmc.ncbi.nlm.nih.gov/articles/PMC12621256/]
- 8. Development of force field parameters for the atomic ... [https://www.nature.com/articles/s42004-025-01722-9]
- 9. of the Generalized Validation GAFF, CGenFF, OPLS-AA... Force Fields [https://pubmed.ncbi.nlm.nih.gov/31557024/]
- 10. Data-driven parametrization of molecular mechanics force ... [https://pubs.rsc.org/en/content/articlehtml/2025/sc/d4sc06640e]
- 11. Direct prediction of intrinsically disordered protein ... [https://www.nature.com/articles/s41592-023-02159-5]
- 12. Revisiting iterative molecular mechanics force field ... [https://chemrxiv.org/engage/chemrxiv/article-details/6882c20e23be8e43d6e0bca5]
- 13. Exploring Meta's Open Molecules 2025 (OMol25) & Universal ... [https://www.rowansci.com/blog/exploring-open-molecules-2025]
- 14. Base-specific RNA force field improving the dynamics ... [https://www.sciencedirect.com/science/article/abs/pii/S0141813022021110]
- 15. RNA-ligand molecular docking: advances and challenges - PMC [https://pmc.ncbi.nlm.nih.gov/articles/PMC10250017/]
- 16. RNA-protein complexes and force field polarizability - PMC [https://pmc.ncbi.nlm.nih.gov/articles/PMC10323139/]
- 17. Surrogate-enabled Bayesian sampling of force ... [https://openforcefield.org/community/news/science-updates/bayesian-surrogate-modeling-2021-09-03/]
- 18. Automated optimization of force field parameters against ... [https://arxiv.org/html/2402.11169v2]
- 19. An Introduction to Enhanced Sampling and... - Compchems [https://www.compchems.com/an-introduction-to-enhanced-sampling-and-metadynamics/]
- 20. Force field (chemistry) [https://en.wikipedia.org/wiki/Force_field_(chemistry)]
- 21. Force Field Limitations of All-Atom Continuous Constant ... [https://pmc.ncbi.nlm.nih.gov/articles/PMC12231151/]
- 22. for stochastic Timescales crossing: inferring the potential from... barrier [https://arxiv.org/html/2507.11456v1]
- 23. | IBM Uncertainty Quantification [https://www.ibm.com/think/topics/uncertainty-quantification]
- 24. Assessing the effect of forcefield parameter sets on the accuracy of... [https://pmc.ncbi.nlm.nih.gov/articles/PMC9549959/]
- 25. Parameterization and validation of force | Fiveable fields [https://fiveable.me/computational-chemistry/unit-9/parameterization-validation-force-fields/study-guide/LvMzZqIJvjD63P0q]
- 26. Deep learning-based dipeptidyl peptidase IV inhibitor screening... [https://bmcbiol.biomedcentral.com/articles/10.1186/s12915-025-02295-8]
- 27. An Efficient GaMD Multi-Level Enhanced Sampling Strategy for... [https://chemrxiv.org/engage/chemrxiv/article-details/6155f2dfaef99c3f9f07cd89]
- 28. - GROMACS 2023.5 documentation Replica exchange [https://manual.gromacs.org/2023.5/reference-manual/algorithms/replica-exchange.html]
- 29. Computer Folding of RNA Tetraloops: Identification of Key Force ... Field [https://pmc.ncbi.nlm.nih.gov/articles/PMC6169534/]
- 30. Toward Convergence in Folding Simulations of RNA Tetraloops... [https://pubmed.ncbi.nlm.nih.gov/35363478/]
- 31. Frontiers | Use of AI -methods over MD simulations in the sampling of... [https://www.frontiersin.org/journals/molecular-biosciences/articles/10.3389/fmolb.2025.1542267/full]
- 32. -based Methods for Simulating, Sampling, and Predicting Protein... AI [https://arxiv.org/html/2509.17224v1]
- 33. Physical validation - GROMACS 2025 .0-beta documentation [https://manual.gromacs.org/2025.0-beta/dev-manual/physical_validation.html]
- 34. Constrained conformational of cluster models of enzymes... sampling [https://github.com/crest-lab/crest/issues/427]
- 35. Training and Validation Loss in Deep - GeeksforGeeks Learning [https://www.geeksforgeeks.org/deep-learning/training-and-validation-loss-in-deep-learning/]
- 36. Machine Learning : Construction, Force ... | CoLab Fields Validation [https://colab.ws/articles/10.1021%2Facs.jpcc.6b10908]
- 37. An efficient workflow for generation of conformational of... ensembles [https://pubs.rsc.org/en/content/articlehtml/2025/cp/d5cp01010a]
- 38. GitHub - AspirinCode/awesome- AI 4MolConformation-MD: List of... [https://github.com/AspirinCode/awesome-AI4MolConformation-MD]
- 39. Force Field Limitations of All-Atom Continuous Constant ... [https://pmc.ncbi.nlm.nih.gov/articles/PMC11398383/]
- 40. Molecular Dynamics Comparing in the Essential... Force Fields [https://pmc.ncbi.nlm.nih.gov/articles/PMC4374674/]
- 41. Systematic Comparison of Atomistic Force Fields for the ... [https://pmc.ncbi.nlm.nih.gov/articles/PMC10938644/]
- 42. Comparative Study of Molecular Mechanics Force Fields for β ... [https://pmc.ncbi.nlm.nih.gov/articles/PMC10302482/]
- 43. 9.4 Applications and limitations of molecular mechanics [https://fiveable.me/computational-chemistry/unit-9/applications-limitations-molecular-mechanics/study-guide/dZdyt01kyu1ZnXxD]
- 44. Exploration and validation of force field design protocols ... [https://pubs.rsc.org/en/content/articlehtml/2022/cp/d2cp02864f]
- 45. Exploring the limits of the generalized CHARMM and ... [https://pmc.ncbi.nlm.nih.gov/articles/PMC11275216/]
- 46. Comparing optimization strategies for force field ... [https://ui.adsabs.harvard.edu/abs/arXiv:1812.00326]
- 47. Common errors when using GROMACS [https://manual.gromacs.org/current/user-guide/run-time-errors.html]
- 48. Rapid parameterization of small molecules using the Force ... [https://pmc.ncbi.nlm.nih.gov/articles/PMC3874408/]
- 49. QM treatment — (GROMACS+)CP2K QM/MM Best Practice ... [https://docs.bioexcel.eu/qmmm_bpg/en/main/input_preparation/QM_treatment.html]
- 50. How to measure and evaluate binding affinities - PMC [https://pmc.ncbi.nlm.nih.gov/articles/PMC7452723/]
- 51. (PDF) A Computational Binding Estimation Affinity with... Protocol [https://www.academia.edu/72258476/A_Computational_Binding_Affinity_Estimation_Protocol_with_Maximum_Utilization_of_Experimental_Data_A_Case_Study_for_Adenosine_Receptor]
- 52. Improving force field accuracy by training against condensed ... [https://pmc.ncbi.nlm.nih.gov/articles/PMC9254460/]
- 53. Understanding and Mitigating Distribution Shifts For ... [https://arxiv.org/html/2503.08674v1]
- 54. Benchmarking forcefields for molecular dynamics ... [https://www.sciencedirect.com/science/article/abs/pii/S0376738824010871]
- 55. Best practices for machine-learned force fields [https://www.vasp.at/wiki/index.php/Best_practices_for_machine-learned_force_fields]
- 56. Recent Force Field Strategies for Intrinsically Disordered ... [https://pmc.ncbi.nlm.nih.gov/articles/PMC8256680/]
- 57. ff14IDPs Force Field Improving the Conformation Sampling ... [https://pmc.ncbi.nlm.nih.gov/articles/PMC5480619/]
- 58. Use of AI-methods over MD simulations in the sampling of ... [https://pmc.ncbi.nlm.nih.gov/articles/PMC12011600/]
- 59. Simulation Best Practices for Lipid Membranes [Article v1.0] [https://pmc.ncbi.nlm.nih.gov/articles/PMC9534443/]
- 60. Diffusing protein binders to intrinsically disordered proteins [https://www.nature.com/articles/s41586-025-09248-9]
- 61. simulations and Molecular | BMC Biology dynamics drug discovery [https://bmcbiol.biomedcentral.com/articles/10.1186/1741-7007-9-71]
- 62. Data-Driven Molecular : A Multifaceted Dynamics - PMC Challenge [https://pmc.ncbi.nlm.nih.gov/articles/PMC7557855/]
- 63. A universal strategy for the creation of machine learning- ... [https://www.nature.com/articles/s41524-017-0042-y]
- 64. Parameter files — ForceField .1 documentation 2025 [https://www.scm.com/doc/ForceField/Parameter_files.html]
- 65. (PDF) Correcting electrostatic due to net‐charge changes in... artifacts [https://www.academia.edu/143681841/Correcting_electrostatic_artifacts_due_to_net_charge_changes_in_the_calculation_of_ligand_binding_free_energies]
- 66. Toward the correction of effective electrostatic forces in... [https://pubmed.ncbi.nlm.nih.gov/26097404/]
- 67. potentials and Electrostatic energies in YASARA solvation [https://www.yasara.org/electrostatics.htm]
- 68. and Physics delivers working AI for industry hybrid AI [https://www.cognite.com/en/resources/blog/physics-and-ai-hybrid-deliver-working-ai-for-industry]
- 69. [2511.13294] A Hybrid -Driven Neural Network Physics ... Force Field [https://arxiv.org/abs/2511.13294]
- 70. On the Validation of Protein Force Based on Structural Criteria... Fields [https://pmc.ncbi.nlm.nih.gov/articles/PMC11103706/]
- 71. Long- versus Short-Range Interactions Defines the Ability of... Sampling [https://pubmed.ncbi.nlm.nih.gov/28805390/]
- 72. Molecular dynamics simulations | Biophysical Chemistry... | Fiveable [https://fiveable.me/biophysical-chemistry/unit-12/molecular-dynamics-simulations/study-guide/DAOHTca5ER0p7vhe]
- 73. Screening Conformer Ensembles with PRISM Pruner | Rowan [https://rowansci.com/blog/screening-conformer-ensembles-with-prism-pruner]
- 74. of Validation files — foyer 0.11.0 documentation force field [https://foyer.mosdef.org/en/latest/reference/validation.html]
- 75. Effects of forcefield and sampling method in all-atom simulations of... [https://pmc.ncbi.nlm.nih.gov/articles/PMC5638406/]
- 76. Evaluation of nine condensed-phase force fields ... [https://pubs.rsc.org/en/content/articlelanding/2021/cp/d1cp00215e]
- 77. Optimization of the Additive CHARMM All-Atom Protein Force ... Field [https://colab.ws/articles/10.1021%2Fct300400x]
- 78. Force field comparison for molecular dynamics simulations ... [https://www.sciencedirect.com/science/article/abs/pii/S0167732224024061]
- 79. Cannot set up force upon save - General Discussion - Avogadro... fields [https://discuss.avogadro.cc/t/cannot-set-up-force-fields-upon-save/2466]
- 80. Conformational Ensembles of an Intrinsically Disordered Protein... [https://pubmed.ncbi.nlm.nih.gov/32840111/]
- 81. questionpro.com/blog/ sampling - bias [https://www.questionpro.com/blog/sampling-bias/]
- 82. your Machine Learning Model - Maarten Grootendorst Validating [https://www.maartengrootendorst.com/blog/validate/]
- 83. DATASW, a tool for HPLC- SAXS data analysis [https://pubmed.ncbi.nlm.nih.gov/26057674/]
- 84. D.P. Goldenberg UofU [https://goldenberg.biology.utah.edu/software.shtml]
- 85. Statistical significance: p value, 0.05 threshold, and ... [https://eurradiolexp.springeropen.com/articles/10.1186/s41747-020-0145-y]
- 86. Addressing challenges in data generation, analysis, and ... [https://www.sciencedirect.com/science/article/pii/S2666386425001651]
- 87. Atomistic Polymer Modeling: Recent Advances and ... [https://pmc.ncbi.nlm.nih.gov/articles/PMC12613811/]
- 88. Evaluating Universal Machine Learning Force Against... Fields [https://arxiv.org/html/2508.05762v1]
- 89. Choice of Force Field for Proteins Containing Structured and ... [https://pmc.ncbi.nlm.nih.gov/articles/PMC7136338/]
- 90. Development and Benchmarking of Open Force Field 2.0.0 [https://pmc.ncbi.nlm.nih.gov/articles/PMC10269353/]
- 91. Molecular Modeling of Ionic Liquids: Force ‐ Field ... | CoLab Validation [https://colab.ws/articles/10.1002%2Fadts.202200274]